Disappearing toolbar under OSX?
-
I have a user that cannot find the toolbar for my plugin any more. It was been working and visible until a couple of days ago.
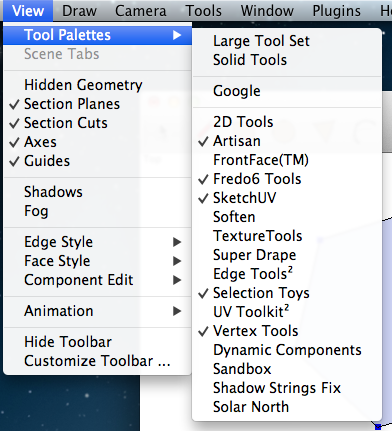
All the menus to the plugin works and the plugin itself it working. The toolbar is listed under Tools Palettes - but apparently not visible at all. :s
===== Vertex Tools Debug Info =====

PLUGIN_NAME; Vertex Tools
PLUGIN_VERSION; 1.1.4
PLUGIN_BUILD_DATE; 2012-24-09

SketchUp; 8.0.15157

RUBY_VERSION; 1.8.5
RUBY_RELEASE_DATE; 2006-08-25
RUBY_PLATFORM; i686-darwin8.10.1

__FILE__;       /Library/Application Support/Google SketchUp 8/SketchUp/Plugins/tt_vertex.rb
PROXY_LOADER;   /Library/Application Support/Google SketchUp 8/SketchUp/Plugins/TT_Vertex/loader.rb

ROOT_PATH;      /Library/Application Support/Google SketchUp 8/SketchUp/Plugins
PATH;           /Library/Application Support/Google SketchUp 8/SketchUp/Plugins/TT_Vertex
CEXT_PATH;      /Library/Application Support/Google SketchUp 8/SketchUp/Plugins/TT_Vertex/CExt/osx
CURSOR_PATH;    /Library/Application Support/Google SketchUp 8/SketchUp/Plugins/TT_Vertex/Cursors
ICONS_PATH;     /Library/Application Support/Google SketchUp 8/SketchUp/Plugins/TT_Vertex/Icons
L10N_PATH;      /Library/Application Support/Google SketchUp 8/SketchUp/Plugins/TT_Vertex/Localisation
WEBDIALOG_PATH; /Library/Application Support/Google SketchUp 8/SketchUp/Plugins/TT_Vertex/webdialog

CEXT_VERSION; 2.0.40
__________
It all appear to be installed correctly. It appear to be a SketchUp glitch - not one of the plugin.
Under Windows I've experienced disappearing toolbars as well - then I could toggle it on and off a few times and it'd re-appear. But I've got no experience with OSX. Anyone got any idea?

-
I don't have experience with Mac toolbars either but is there any chance it's floating somewhere either behind the SU window or off-screen?
-
@gaieus said:
I don't have experience with Mac toolbars either but is there any chance it's floating somewhere either behind the SU window or off-screen?
That's what I thought as well. I suggested resetting the workspace - but the user did one better and reinstalled SketchUp.
...maybe there was the settings left that made it prevail...
I'll ask the user to reset the workspace.
-
Reset workspace only helps with dialogs/windows (from the Window menu). I do not think it resets the toolbars, too.
This has happened to me on windows. In case something is behind the SU window, try to move the window around (minimizing it will minimize all toolbars off, too) and if it is off-screen somehow, he can try to make the resolution of the sceen bigger temporarily (if this is possible on Macs) to catch it.
-
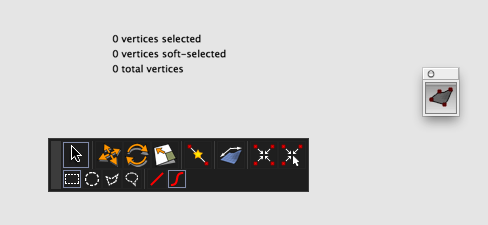
Are we talking about the single button to activate tool?

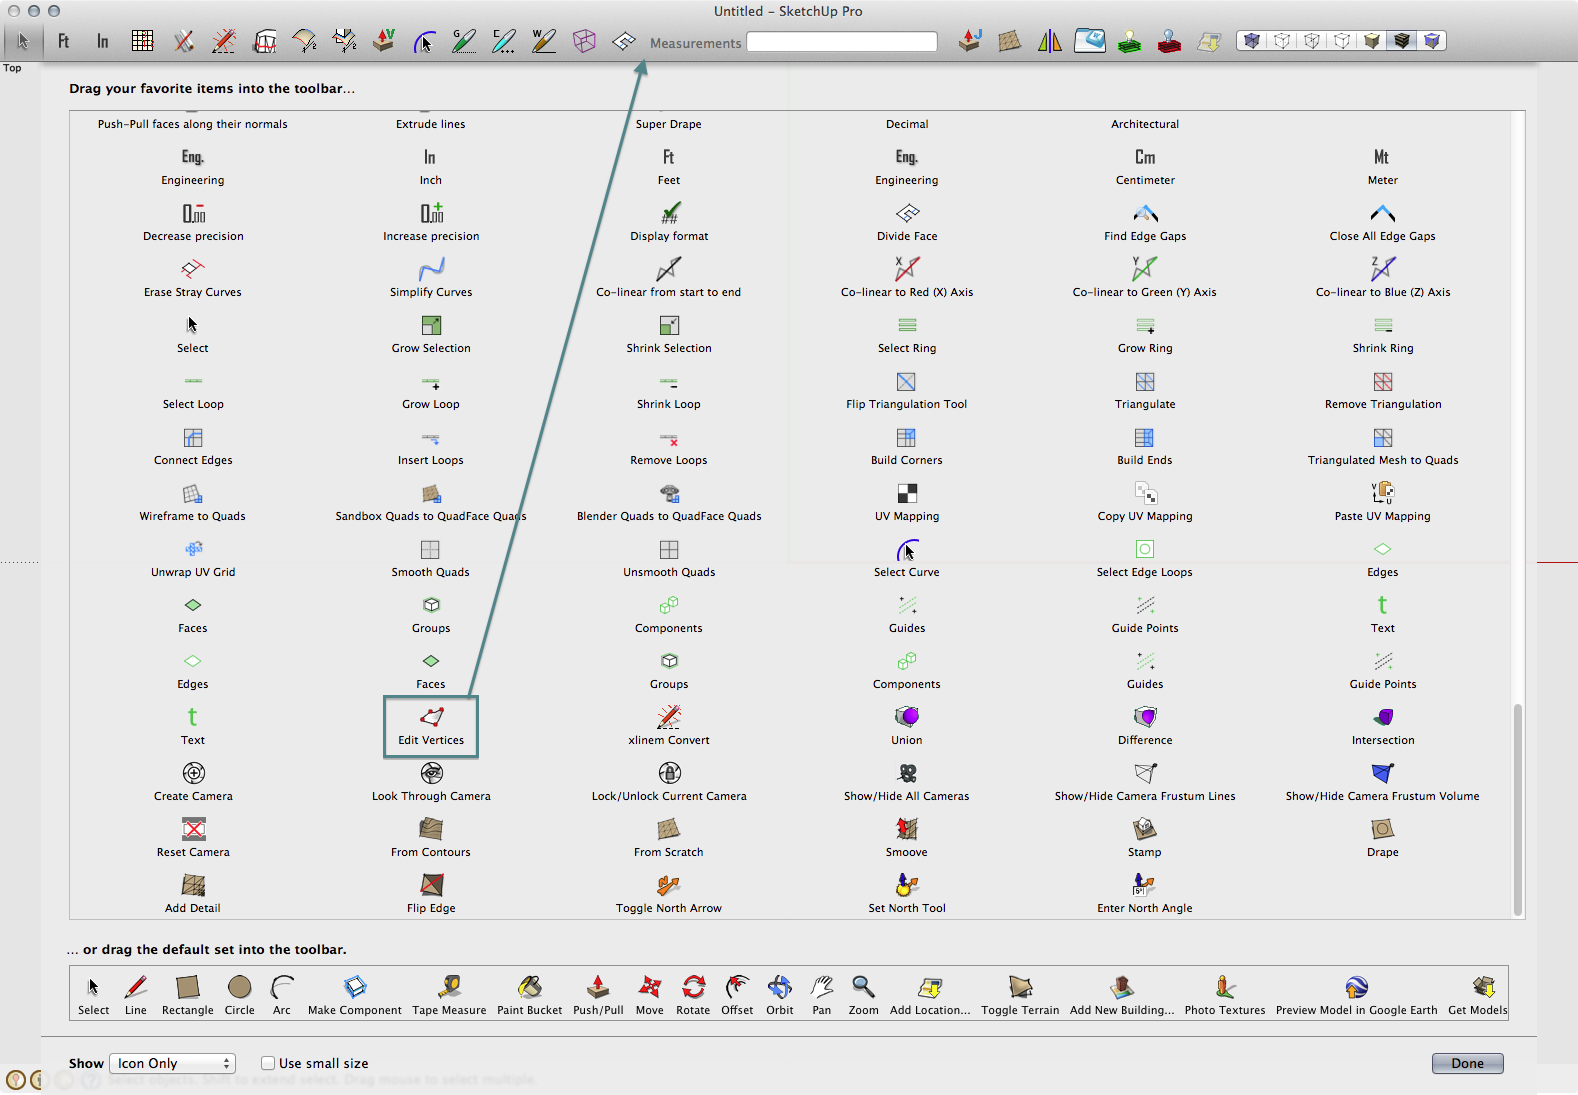
Is the icon visible in customizable toolbar?
If so, might be more convenient to drag icon(if visible) into customizable toolbar as those single button floating toolbars are annoying anyway…
Shortcut is my preferred method.

-
you could check the 'defaults' position or just set a new one
for position-
or what ever your toolbar is actually called.
for visibility it's the Sketchup version to give
<key>SketchUp.Toolbars.Vertex Tools.Visible</key>
<string>1</string>
should show up on restart...
john -
@wind-borne said:
Are we talking about the single button to activate tool?
Yes. I'll point the user to these screenshots and see what he makes out of it.
-
@gaieus said:
I don't have experience with Mac toolbars either but is there any chance it's floating somewhere either behind the SU window or off-screen?
Hi, I'm the one with the problem. I've eliminated the possibility of it floating behind the SU window. I'll have to think about the off-screen possibility.
@wind-borne said:
Are we talking about the single button to activate tool?
.Nope, the single button is there. It's the long toolbar that appears after one clicks the button that as wondered off.
@thomthom said:
@wind-borne said:
Are we talking about the single button to activate tool?
Yes. I'll point the user to these screenshots and see what he makes out of it.
No, it's the toolbar not the activate button.
-
@gt5 said:
Nope, the single button is there. It's the long toolbar that appears after one clicks the button that as wondered off.
@thomthom said:
@wind-borne said:
Are we talking about the single button to activate tool?
Yes. I'll point the user to these screenshots and see what he makes out of it.
No, it's the toolbar not the activate button.
That toolbar does occasionally disappear for me also, usually when editing a group.
If I close and reopen group the toolbar reappears in the same space as before when Vertex Tools is reactivated, never had toolbar move.
I've gotten used to doing that without giving much thought. -
@wind-borne said:
That toolbar does occasionally disappear for me also, usually when editing a group.
If I close and reopen group the toolbar reappears in the same space as before when Vertex Tools is reactivated, never had toolbar move.
I've gotten used to doing that without giving much thought.I've even tried a new window, 2 quads, no toolbar.
-
@driven said:
you could check the 'defaults' position or just set a new one
for position-
or what ever your toolbar is actually called.
for visibility it's the Sketchup version to give
<key>SketchUp.Toolbars.Vertex Tools.Visible</key>
<string>1</string>
should show up on restart...
johngood idea, didn't work
-
@wind-borne said:
That toolbar does occasionally disappear for me also, usually when editing a group.
Really? And only with Vertex Tools?


-
Try this - from
Windows > Ruby Console: (Type each command and see what the results are)t=UI.toolbar('Vertex Tools')t.visible?t.get_last_statet.show -
@thomthom said:
Try this...
t=UI.toolbar('Vertex Tools')
#UI::Toolbar:0x165b4e04
t.visible?
true
t.get_last_state
1
t.show
nil -
@thomthom said:
@wind-borne said:
That toolbar does occasionally disappear for me also, usually when editing a group.
Really? And only with Vertex Tools?


Now we have established gt5's problem is not the button but the toolbar inside of Vertex Tools that is missing.
The main toolbar and information panel within Vertex Tools have at times disappeared when editing inside of a group. Vertices will be highlighted blue as if waiting to be selected, no toolbar and nothing can be selected in Vertex Tools until I exit group and reenter group edit mode and open Vertex tools again. Then all functions normal. Select freehand initial tool. Of course I couldn't recreate today

I use a different color for selections in SU, that blue only shows up inside of Vertex Tools.I rely on 'edit vertices' shortcut to activate tool so I never have that initial toolbar button visible if that is what you are asking about.
-
@gt5 said:
@wind-borne said:
Are we talking about the single button to activate tool?
.Nope, the single button is there. It's the long toolbar that appears after one clicks the button that as wondered off.
Ah! I completely missed this!
 Sorry - now I'm with you!
Ok - lets debug that toolbar:
Can you please type:
TT_Vertex.settings -
@wind-borne said:
The main toolbar and information panel within Vertex Tools have at times disappeared when editing inside of a group. Vertices will be highlighted blue as if waiting to be selected, no toolbar and nothing can be selected in Vertex Tools until I exit group and reenter group edit mode and open Vertex tools again. Then all functions normal. Select freehand initial tool. Of course I couldn't recreate today

When this happens, can you please open the Ruby Console and see if you're getting any error messages?
-
@thomthom said:
Ok - lets debug that toolbar:
Can you please type:
TT_Vertex.settingsTT_Vertex.settings
#<TT_Vertex::Settings:0x169d16f4 @section="TT_Vertex", @cache={:remember_uv=>true, :view_normals=>true, :context_menu=>true, :radius=>0.0, :vertexinfo_x=>615, :axis_lock=>false, :normal_size=>20, :vertexinfo_y=>234, :gizmo_visible=>true, :l10n=>"en", :vertex_size=>6, :merge_tolerance=>0.393700787401575, :last_select_tool=>:rect, :last_tool=>"T_Select_Rectangle", :toolbar_x=>1133, :axis=>:local, :auto_smooth=>true, :ss_cos=>false, :toolbar_y=>202, :initial_tool=>"T_Select"}> -
hm... And your monitor resolution is larger than 1133px wide? Or, is your viewport that wide?
Sketchup.active_model.active_view.vpwidthAnd if you have the Ruby Console open while you use Vertex Tools, do you see any error messages appearing?
-
@thomthom said:
hm... And your monitor resolution is larger than 1133px wide? Or, is your viewport that wide?
Sketchup.active_model.active_view.vpwidthAnd if you have the Ruby Console open while you use Vertex Tools, do you see any error messages appearing?
Sketchup.active_model.active_view.vpwidth
1766no errors in console
Hello! It looks like you're interested in this conversation, but you don't have an account yet.
Getting fed up of having to scroll through the same posts each visit? When you register for an account, you'll always come back to exactly where you were before, and choose to be notified of new replies (either via email, or push notification). You'll also be able to save bookmarks and upvote posts to show your appreciation to other community members.
With your input, this post could be even better 💗
Register LoginAdvertisement


