Creating 3D Surface Graphs in SketchUp
-
Hi,
I don't know if this is possible to do but I will ask anyway.
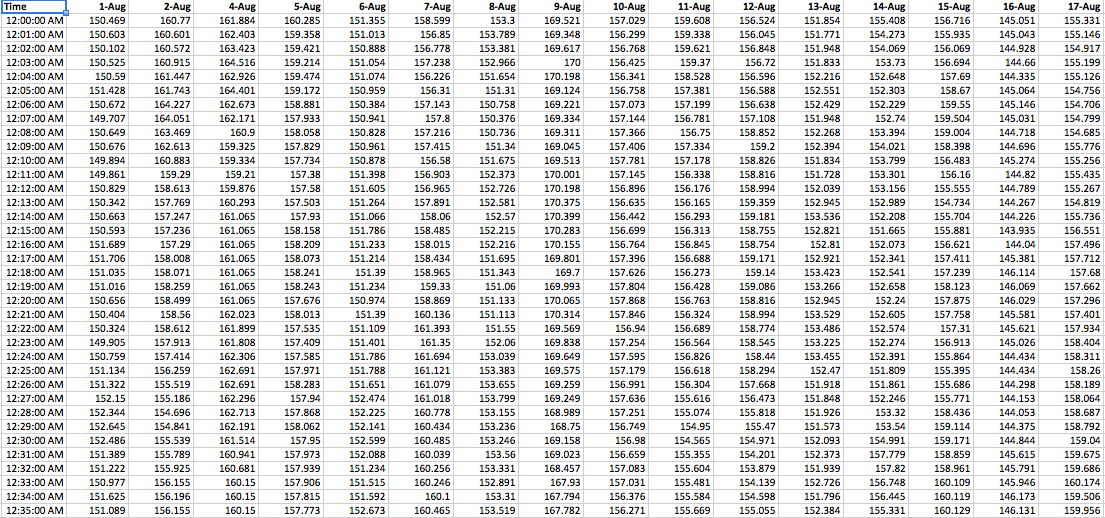
I have gathered a bunch of data in Excel (1 minute intervals over a month) and would like to create a surface graph in SketchUp with this data. Is this possible and if so how would I do it?
I have attached a sample picture of the data I want to create the graph from.
I know I can do this in Excel but I would like the graph to be interactive and take multiple angles.
-
You could convert your table into a 3-column list of x, y and z values and use them to create a point cloud [from a CSV version of it] with Didier Burr's Cloud. Then use TIG's Triangulate Points to create a mesh from the point cloud.
-
As Dave says, re-tabulating the data as XYZ columns, with one 'point' per line [row] will let you read in points from the CSV file for later use in forming a mesh from them, or even make the mesh directly from the CSV itself.
There are also other plugins to 'color-by-height', so using that on the mesh - with say with Z.min='green' and Z.max='red' to give a good visual effect...
-
@dave r said:
You could convert your table into a 3-column list of x, y and z values and use them to create a point cloud [from a CSV version of it] with Didier Burr's Cloud. Then use TIG's Triangulate Points to create a mesh from the point cloud.
Do you know if Cloud will work on a Mac?
-
Does the Cloud plugin work for Mac?
-
It should do.
The others like my direct mesh maker are cross-system tools - most are and say when they 'are not', not when they 'are'
Hello! It looks like you're interested in this conversation, but you don't have an account yet.
Getting fed up of having to scroll through the same posts each visit? When you register for an account, you'll always come back to exactly where you were before, and choose to be notified of new replies (either via email, or push notification). You'll also be able to save bookmarks and upvote posts to show your appreciation to other community members.
With your input, this post could be even better 💗
Register Login


Advertisement