Creating 3D Surface Graphs in SketchUp
-
Hi,
I don't know if this is possible to do but I will ask anyway.
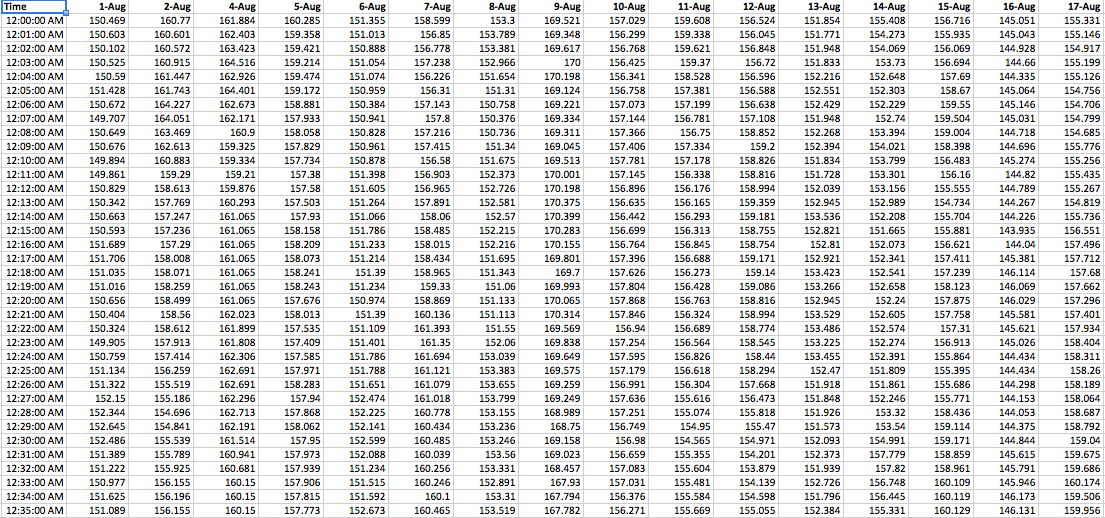
I have gathered a bunch of data in Excel (1 minute intervals over a month) and would like to create a surface graph in SketchUp with this data. Is this possible and if so how would I do it?
I have attached a sample picture of the data I want to create the graph from.
I know I can do this in Excel but I would like the graph to be interactive and take multiple angles.

-
You could convert your table into a 3-column list of x, y and z values and use them to create a point cloud [from a CSV version of it] with Didier Burr's Cloud. Then use TIG's Triangulate Points to create a mesh from the point cloud.
-
As Dave says, re-tabulating the data as XYZ columns, with one 'point' per line [row] will let you read in points from the CSV file for later use in forming a mesh from them, or even make the mesh directly from the CSV itself.
There are also other plugins to 'color-by-height', so using that on the mesh - with say with Z.min='green' and Z.max='red' to give a good visual effect...
-
@dave r said:
You could convert your table into a 3-column list of x, y and z values and use them to create a point cloud [from a CSV version of it] with Didier Burr's Cloud. Then use TIG's Triangulate Points to create a mesh from the point cloud.
Do you know if Cloud will work on a Mac?
-
Does the Cloud plugin work for Mac?
-
It should do.

The others like my direct mesh maker are cross-system tools - most are and say when they 'are not', not when they 'are'
Advertisement


