[Request] - Component's options report
-
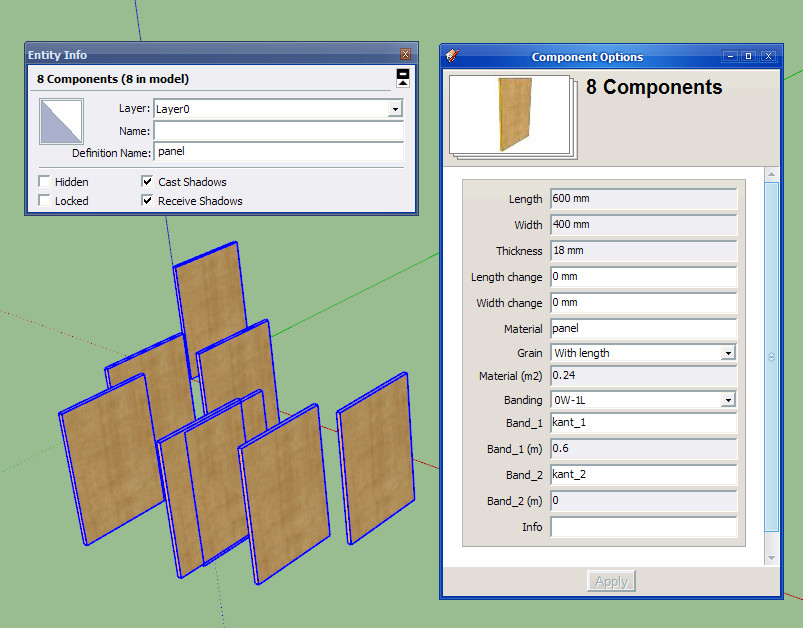
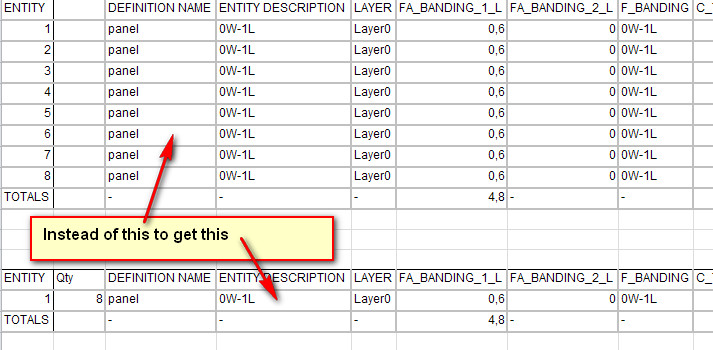
Now, that at least we can extract some data is there a way to filtered it. For instance to get components quantity and


-
Up.
-
I found a way to convert the inches, but the problem with counting components still remain. Any idea how to include this into the report?

-
Still hoping...

-
Since your example is written in 'Cyrillic' [?] it's hard to understand... Ddo you find the details of a component and also want to show a total number of it in the report - like on the Entity Info window ?
You need to find its definition and then its instances and count them, the format the html/csv to include the 'count' - something like...ss=model.selection ents=ss.to_a ### OR ents=model.entities ### OR ents=model.active_entities defns=[] ### to become a list of used definitions ents.each{|e| if e.class==Sketchup;;ComponentInstance defns<< e.definition if not defns.include?(e.definition) end#if } counts=[] ### to become a collection of definitions [by name] and their instance counts [as a string] defns.each[|d| counts<< [d.name, d.instances.length.to_s] }- note it's untested!
You now have an array of selected [or all used] definitions by name, paired with the total of their instances....
So to output it to the Ruby Console use something like...
counts.each{|e|
  puts e[0]+"\t"+e[1]
}
I'll leave the formating of the csv / html lines etc to you or others.............

- note it's untested!
-
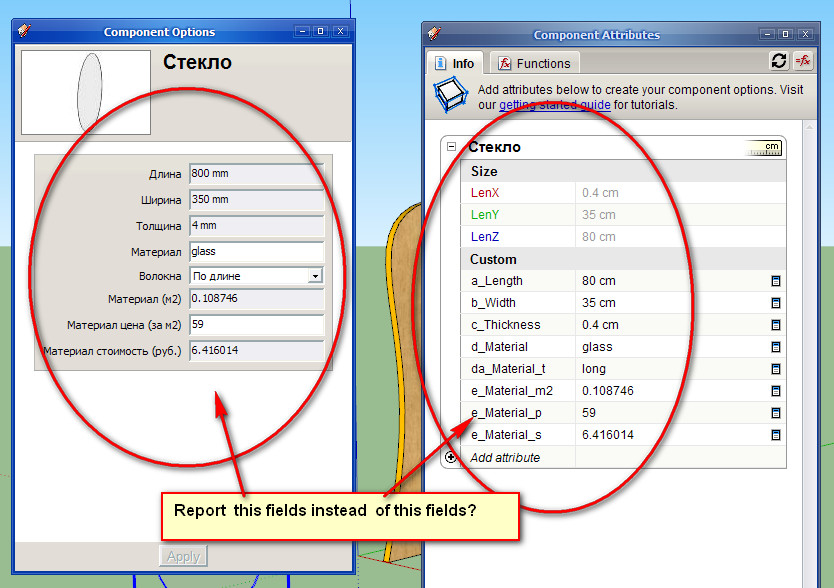
Thanks so much! I made a component in English to show what I mean:


The report is a real mess and in inches, but I managed to clean it up in Excel.
-
So you are almost sorted

-
I did need a plugin to creat a simple list of components with: LenX, LenZ, LenY, Material, and Name
Not the boundinbox, because sometime in the draw the component could stay in angle different that axes.
Please need help, Could give a good Cookie to your jar.
Will use this to report list of furniture components to outside software that will calculate price.
Need SAP!
Best Regards
 Celio
Celio -
I'm thinking of creating a report writer that allows you to pick, choose and specify the order of columns in a csv report. The report definition can then be given a name that you can choose from a pick list when running subsequent reports.
Any one interested?
-
I'm really interested in this!
I would like to help as well but I'm a complete beginner
-
If there is enough interest then I would jump into it -- otherwise this is on a back burner.
-
@garry k said:
I'm thinking of creating a report writer that allows you to pick, choose and specify the order of columns in a csv report. The report definition can then be given a name that you can choose from a pick list when running subsequent reports.
Any one interested?
Would it also allow us to convert the columns names?
I mean, my contractors aren't much interested in LenZ, but they could very well relate to height.
Could we also Combine values?
LenX | LenY | LenZ columns, could be merged into a single Dimensions Column and each LenX, LenY and LenZ value would then turn into something like 1.5m X 2.0m X 0.005m?
EDIT: Oh and if unit conversion would be there too...
-
Column names would be handled by my translation layer.
You could convert English translation (which is normally just a template) to what ever you want.
Normally with my plugins I try to honor the units that the user has set up for the model.Yes - Sketchup stores data a certain way. BUT I Am a big fan of metric - so I honor it and convert into mm.
-
I'm sure you'd pull off something very good...
Advertisement


