[Talk] Ruby Debugger for SketchUp 14+
-
The Readme on Github says that Mac is not supported yet, but the repository contains project files for Xcode and build succeeded on my Mac. However, there is no discussion of where to put the dylib or how to invoke it. I tried putting it with the other dylibs in the Frameworks folder and activating with the command line args as suggested for Windows, but I can't see any evidence that it does anything (SU starts and seems to run as normal...). Has anybody gotten this to work on Mac yet?
Steve
-
@slbaumgartner said:
Has anybody gotten this to work on Mac yet?
been awaiting your return, I only had a brief look...
than ran...
john -
@slbaumgartner said:
The Readme on Github says that Mac is not supported yet, but the repository contains project files for Xcode and build succeeded on my Mac. However, there is no discussion of where to put the dylib or how to invoke it.
Work in progress. I don't recall right now if you will need a new release of SU for OSX before it will work. I'll check in.
-
Do these IDE's somehow notify SketchUp that the file has been modified and needs to be reloaded by SketchUp?
-
Bugra said they implemented the communication protocol that some of the Ruby debugger gems also implement. Documented (somewhat) here:
-
Here is a demo video of a Notepad++ plugin I am working on for SketchUp Debugger communications.
It is written in Python and requires the PythonScript plugin for Notepad++. The video shows setting a breakpoint, inspecting local variables, and stepping through the script.
There's no user interface and I use a lot of typed commands, so it is best to watch the video in high quality and full screen.
Just made it to show possibilities/measure interest/gather feedback.
-
Nice! Can't wait to try this
-
@jim said:
Here is a demo video of a Notepad++ plugin I am working on for SketchUp Debugger communications.
I'd much rather stay with using NP++.
Why Python, and perhaps GitHub it ?
-
@dan rathbun said:
Bugra said they implemented the communication protocol that some of the Ruby debugger gems also implement. Documented (somewhat) here:
I am wondering if this ruby debug ide protocol is based on (or compatible with,)
the DBGp protocol: http://www.xdebug.org/docs-dbgp.php#description -
Whimper! Bugra (or whoever) please, please! We Mac users are dying of envy....
Steve
-
@slbaumgartner said:
Whimper! Bugra (or whoever) please, please! We Mac users are dying of envy....
Soon.
 We need it as well - we share your pain.
Btw, have you checked the GitHub repo lately?

-
Nothing seems to have changed in at least a month (and that seems to be only the readme.)
If you have something to announce, come on out and say it.
-
@dan rathbun said:
Why Python, and perhaps GitHub it ?
Why Python? Python just seemed like my best chance for success for a proof-of-concept compared to the alternative ways to extend Npp.
The Python code is currently posted on this Gist. I'm sure it's ugly as I don't know exactly what I'm doing in Python yet - I am learning as I go about Python, PythonScript, and the Npp environment. I'll put it in a proper Github repo when it's more stable.
Maybe there's a Pythonista around who would be willing to help out?
This is also a bit complicated to setup - I had to compile my own version of PythonScript.dll from the latest GitHub source to get the margin click callback to return the correct values.
One big downside of PythonScript is it appears to have weak support for creating Toolbars in Npp, so creating a good user interface may be a problem.
I would love for this to be written in c++ to take advantage of more features of Npp, but that would require learning c++ first and that takes time.
@dan rathbun said:
I am wondering if this ruby debug ide protocol is based on (or compatible with,)
the DBGp protocolNo, DBGp is incompatible.
The commands that the SketchUp Debugging Server accepts can be found by interpreting these regular expressions.
-
Yea.. I agree I poked around in the NPP Plugin "How to" today. The C++ stuff is too complex to learn quickly.
I did not find any Ruby binding, so Python would be the next best thing. It is similar to ruby (without all the "end"s.)
I tried first to install PythonScript in my %AppData% path where all my other NPP plugins are installed, but got an error when trying to open the Python Console. (Something about Python being an ANSI version, and incompatible with the Unicode NPP.)
Installing it in the %ProgramFiles% path works (as the doc stated that is where to install it.) So it will require Admin privileges.
-
I opened the config dialog, hilited "sudb.py" and clicked on the "Add" button. It was added to the top-level "Python Script" menu.
I then made a (quick and dirty) BMP copy of the SU icon, and saved it into "Notepad++/plugins/images/Toolbar" and added the script to the Toolbar list, then hilited it (in the list,) and went thru the file picker after clicking the "Set Icon" button.
I also set the "Initization" to ATSTARTUP:
Restarted Notepad++ and the SketchUp icon appears on the toolbar.
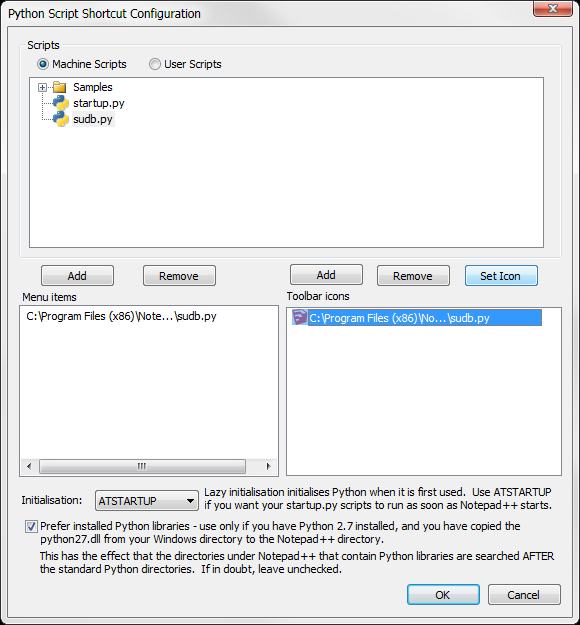

-
And doing the above caused a textfile "PythonScriptStartup.cnf" to be created in "%AppData%\Roaming\Notepad++\plugins\config" (UTF-8 no BOM, Dos/Win EOLs)
containing:
ITEM/C;\Program Files (x86)\Notepad++\plugins\PythonScript\scripts\sudb.py TOOLBAR/C;\Program Files (x86)\Notepad++\plugins\PythonScript\scripts\sudb.py/C;\Program Files (x86)\Notepad++\plugins\images\Toolbar\SketchUp.bmp SETTING/PREFERINSTALLEDPYTHON/1 SETTING/STARTUP/ATSTARTUP -
@dan rathbun said:
And doing the above caused a textfile "PythonScriptStartup.cnf" to be created in "%AppData%\Roaming\Notepad++\plugins\config" (UTF-8 no BOM, Dos/Win EOLs)
Oh cool, this means a Toolbar with icons can be created from the plugin. Thanks.
Too bad Tooltips on the icons do not seem to be supported...
-
I went ahead and made a github repo for this.

Build software better, together
GitHub is where people build software. More than 150 million people use GitHub to discover, fork, and contribute to over 420 million projects.

GitHub (github.com)
Dan, would you prefer a new topic for discussing issues specifically related to this project?
-
@jim said:
Dan, would you prefer a new topic for discussing issues specifically related to this project?
Yes that would be good ... and can also log issues on the repo site.
-
I haven't had a chance to look at the debugger yet but the first thing I thought when I read about was, is this a backdoor that can be used to defeat the .rbs encrypted rubies? Does the debugger reveal anything about the current line of execution, or does it just deliver line numbers? When displaying data about a variable, does it volunteer variable names or does it just respond with a value?
I would be very disappointed to find out it did.

Hello! It looks like you're interested in this conversation, but you don't have an account yet.
Getting fed up of having to scroll through the same posts each visit? When you register for an account, you'll always come back to exactly where you were before, and choose to be notified of new replies (either via email, or push notification). You'll also be able to save bookmarks and upvote posts to show your appreciation to other community members.
With your input, this post could be even better 💗
Register Login


Advertisement