How to draw a limit surface from array ?
-
I would like to draw in Sketchup a 3D graph by importing some value with equally distant points in space along the direction of the three axes x, y, z with values from 0 to 100.
But I want to get only a surface that joins the points with the same value, for example 50 or 25 only.Who knows what logic can I use?
How to build the limit surface of the sought values?
Some links to suggest?For instance, the form that should leave the development should be like an airship or a ball with some irregular surface like the graphs of the noise or heat.
I don't want to get the 3D graph with other software, but developing the graph directly in sketchup.
-
I have to admit, I don't understand the question at all. But Jim has a ruby where you can graph equations in SU if that helps.
SketchUp Graphing Plugin
Update: 2010 December 05 , a cold and snowy Sunday morning. Add function to Layer (allows Color By Layer) Add Function to Group Users can...
(sketchuptips.blogspot.com)
Chris
-
And you have the 3 lines tools who can be useful

-
Also suggest you find Klaudius's "K_tools.rb" [Try: http://www.crai.archi.fr/rubylibrarydepot/ruby/k_tools_21.rb ] and look at some of the methods in that. It has 3D graphing functions [e.g. 'graph_3d'] using initial input as formulas... reading the data from a file as arrays should be very similar as at some point K_tools had nested 'do' loops calculating the points and you could nest xs.each{|x|ys.each{|y|...}} in a similar way [it really depends on how you read data into array(s) ?]... It also faces the mesh, so it should help you a lot...
-
Thanks for the suggestions, but the plugins that I saw I did not help me.
My problem is different from representing mathematical functions.
I have to wrap with a surface all points that have the same value. This area will limit the value and all points interior to the surface will have greater values.
The most trivial thing you can do is to draw only the points that have value> = the limit.
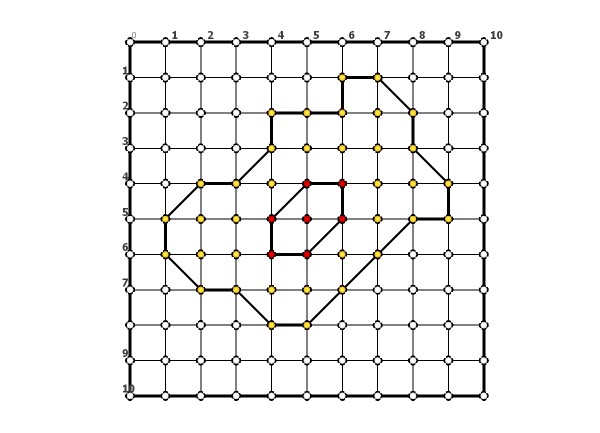
Is more difficult to link their points with value> = the limit.We try to simplify keeping in 2D:
Suppose you have a matrix of 10x10 points and the values of each point are:
White = 0
yellow = 25
red = 50
How do I find the polyline that encloses the values of 25 and 50?
I do not want to connect together all the points with the same value, but only find the outline.

-
look at wikipedia, keyword voronoi, convex hull, and the highlighted keywords in the texts. Your diagram looks just like some example illustrations I stumbled on the other day while reading about these concepts.
good luck -
Thanks for the suggestion. I think that's exactly what I was looking for.
I will study the algorithms and will see what happens ... -
I assume the grid is regular ?
Parse the array into sub-sets of the same Z value.
Starting with the highest Z-set, find the max and min X and Ys in the set.
Test each point in an X column comparing to max Y and min Y. Add these to a points array.
Test each point in a Y row comparing to max X and min X. Add these to the points array.
Check to see that these points could form a face - if not do next lowest Z set...
Do next lowest Z set the same way... this time the face2 could also have an inner loop formed from face1 - add this points set into the array IF you want the 'hole'...
Do the next lowest Z set etc, face3 could have an inner loop formed by face2 outer loop etc...
Now we have a set of points that would form faces [facepts1.facepts2,facepts3,..] each with a perimeter that match the points Z height.
Assuming you want to move each face independently then make facegroup for each face - add_face(points) - and move it up in the Z.
In the group erase any face with only one outer loop IF it's NOT face1 - this forms the donut for face2/3/4 etc. If you want a face without a hole simply don't add the inner loop's points as above...
You can explode the groups if desired once the faces are placed.
Co-linear points that won't face, re-entrant loops and multiple holes etc might prove difficult ?If the points are not 'gridded' a similar principle applies but you might want to [re]consider how pairs of max/min points are found...
Advertisement


