sketchucation logo sketchucation
    • Login
    1. Home
    2. trottolino
    ℹ️ Licensed Extensions | FredoBatch, ElevationProfile, FredoSketch, LayOps, MatSim and Pic2Shape will require license from Sept 1st More Info
    T
    Offline
    • Profile
    • Following 0
    • Followers 0
    • Topics 3
    • Posts 10
    • Groups 1

    trottolino

    @trottolino

    10
    Reputation
    1
    Profile views
    10
    Posts
    0
    Followers
    0
    Following
    Joined
    Last Online

    trottolino Unfollow Follow
    registered-users

    Latest posts made by trottolino

    • RE: Refresh and stop inside a long routine

      @trottolino said:

      Hello to all.
      Who can help me to insert commands to "refresh" and "stop" during the calculation in a routine that generates a drawing with hundreds of faces?
      I tried to use the method "invalidate" and "onCancel", but with poor results.
      For example, given the following simple procedure for calculation:
      **def test_cancel_refresh @my_model = Sketchup.active_model @my_entities = @my_model.entities @step = 10 @n_tot = @step*@step*@step for @z in 1..@step for @y in 1..@step for @x in 1..@step @x0 = @x-1 @y0 = @y-1 @z0 = @z-1 @x1 = @x0+0.5 @y1 = @y0+0.5 @z1 = @z0+0.5 @pt0 = Geom::Point3d.new(@x0,@y0,@z0) @pt1 = Geom::Point3d.new(@x1,@y0,@z0) @pt2 = Geom::Point3d.new(@x1,@y1,@z0) @pt3 = Geom::Point3d.new(@x0,@y1,@z0) @pt4 = Geom::Point3d.new(@x0,@y0,@z1) @pt5 = Geom::Point3d.new(@x1,@y0,@z1) @pt6 = Geom::Point3d.new(@x1,@y1,@z1) @pt7 = Geom::Point3d.new(@x0,@y1,@z1) @my_entities.add_face(@pt0,@pt1,@pt2,@pt3) @my_entities.add_face(@pt4,@pt5,@pt6,@pt7) @my_entities.add_face(@pt0,@pt4,@pt5,@pt1) @my_entities.add_face(@pt3,@pt7,@pt6,@pt2) @my_entities.add_face(@pt0,@pt4,@pt7,@pt3) @my_entities.add_face(@pt1,@pt5,@pt6,@pt2) @prog = @x + (@y-1)*@step + (@z-1)*@step*@step @msg = @prog.to_s Sketchup.status_text = "Status: " + @prog.to_s + "/" + @n_tot.to_s end end end end**
      The status message (where I write the progression) is visible since about 50% and after stop, the screen becomes blank and everything freezes until the end of the routine, when finally happens the screen regeneration.
      Rather, I would always see the progression and sometimes even regenerate the screen.
      It should also be possible to stop at any time of the calculation by pressing the ESC key.

      How can I effectively incorporate these controls in my script?
      I did not find examples of this.

      Did I asked a too simple question or no one knows the solution?
      posted in Developers' Forum
      T
      trottolino
    • RE: SketchUp RUBY API Wishlist [way of coding wishes, please]

      @jadema said:

      How about a method to refresh the SketchUp display when executing long scripts? Today the interface looks like it is frozen when you change focus to another window and then back to SketchUp. The display gets refreshed only when the script completes or a dialog box that requires user input is displayed.

      I'm experiencing the same problem with a routine that generates thousands of faces. The calculation is sometimes very long, but with the screen locked is impossible to understand the percentage of completion and when the calculation will end.
      You have found a solution in the meantime?

      posted in Developers' Forum
      T
      trottolino
    • Refresh and stop inside a long routine

      Hello to all.
      Who can help me to insert commands to "refresh" and "stop" during the calculation in a routine that generates a drawing with hundreds of faces?
      I tried to use the method "invalidate" and "onCancel", but with poor results.
      For example, given the following simple procedure for calculation:
      def test_cancel_refresh @my_model = Sketchup.active_model @my_entities = @my_model.entities @step = 10 @n_tot = @step*@step*@step for @z in 1..@step for @y in 1..@step for @x in 1..@step @x0 = @x-1 @y0 = @y-1 @z0 = @z-1 @x1 = @x0+0.5 @y1 = @y0+0.5 @z1 = @z0+0.5 @pt0 = Geom::Point3d.new(@x0,@y0,@z0) @pt1 = Geom::Point3d.new(@x1,@y0,@z0) @pt2 = Geom::Point3d.new(@x1,@y1,@z0) @pt3 = Geom::Point3d.new(@x0,@y1,@z0) @pt4 = Geom::Point3d.new(@x0,@y0,@z1) @pt5 = Geom::Point3d.new(@x1,@y0,@z1) @pt6 = Geom::Point3d.new(@x1,@y1,@z1) @pt7 = Geom::Point3d.new(@x0,@y1,@z1) @my_entities.add_face(@pt0,@pt1,@pt2,@pt3) @my_entities.add_face(@pt4,@pt5,@pt6,@pt7) @my_entities.add_face(@pt0,@pt4,@pt5,@pt1) @my_entities.add_face(@pt3,@pt7,@pt6,@pt2) @my_entities.add_face(@pt0,@pt4,@pt7,@pt3) @my_entities.add_face(@pt1,@pt5,@pt6,@pt2) @prog = @x + (@y-1)*@step + (@z-1)*@step*@step @msg = @prog.to_s Sketchup.status_text = "Status: " + @prog.to_s + "/" + @n_tot.to_s end end end end
      The status message (where I write the progression) is visible since about 50% and after stop, the screen becomes blank and everything freezes until the end of the routine, when finally happens the screen regeneration.
      Rather, I would always see the progression and sometimes even regenerate the screen.
      It should also be possible to stop at any time of the calculation by pressing the ESC key.

      How can I effectively incorporate these controls in my script?
      I did not find examples of this.

      posted in Developers' Forum
      T
      trottolino
    • RE: How to draw a limit surface from array ?

      Thanks for the suggestion. I think that's exactly what I was looking for.
      I will study the algorithms and will see what happens ...

      posted in Developers' Forum
      T
      trottolino
    • RE: How to draw a limit surface from array ?

      Thanks for the suggestions, but the plugins that I saw I did not help me.

      My problem is different from representing mathematical functions.

      I have to wrap with a surface all points that have the same value. This area will limit the value and all points interior to the surface will have greater values.

      The most trivial thing you can do is to draw only the points that have value> = the limit.
      Is more difficult to link their points with value> = the limit.

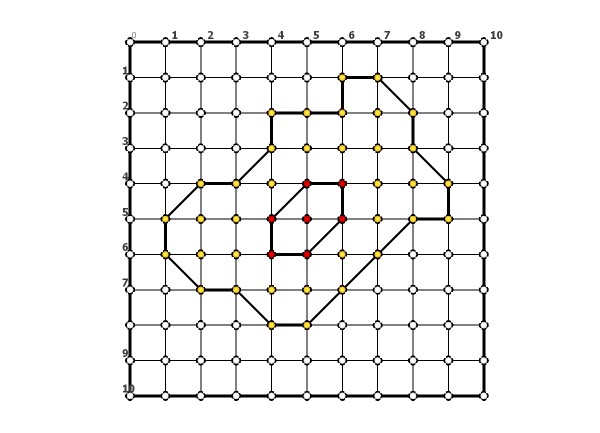
      We try to simplify keeping in 2D:
      http://www.sketchucation.com/forums/scf/download/file.php?mode=view&id=26276&sid=f9c828cb21c3c7ddcb1b7b3801a86536

      Suppose you have a matrix of 10x10 points and the values of each point are:
      White = 0
      yellow = 25
      red = 50
      How do I find the polyline that encloses the values of 25 and 50?
      I do not want to connect together all the points with the same value, but only find the outline.


      Contour2D.jpg

      posted in Developers' Forum
      T
      trottolino
    • How to draw a limit surface from array ?

      I would like to draw in Sketchup a 3D graph by importing some value with equally distant points in space along the direction of the three axes x, y, z with values from 0 to 100.
      But I want to get only a surface that joins the points with the same value, for example 50 or 25 only.

      Who knows what logic can I use?
      How to build the limit surface of the sought values?
      Some links to suggest?

      For instance, the form that should leave the development should be like an airship or a ball with some irregular surface like the graphs of the noise or heat.

      I don't want to get the 3D graph with other software, but developing the graph directly in sketchup.

      posted in Developers' Forum
      T
      trottolino
    • RE: Transformation.axes problem

      Of course.
      In the meantime I also found the right solution.

      This Sketchup is very powerful when you found the correct sequence of commands script!
      Thanks again.

      I think for my project (some ambitious) I will still need your advice.
      I hope that you are always online these days as then.

      Bye

      posted in Developers' Forum
      T
      trottolino
    • RE: Transformation.axes problem

      But this second transformation moves component from its origin @p0
      Did you notice?

      posted in Developers' Forum
      T
      trottolino
    • RE: Transformation.axes problem

      Great, this works perfectly!
      Think that this method was under my eyes but I've never tried it.
      Thank you very much.

      And if I want to insert my component with a different scale, how do I combine multiple transformations?

      posted in Developers' Forum
      T
      trottolino
    • Transformation.axes problem

      Hello everyone.
      I need to display the drawving direction of all the edges of one or more curves in my draw.
      The observer must be able to check for any edge of the selected curves which is the first and the end point.
      I thought to do this by placing at the center of each edge a 3D arrow component oriented from first point to end point.

      This is the code of my script:

      @mycomponent is my 3D arrow component

      @mymodel.selection.each {|e|
      if( e.typename == "Edge" )
      @myedgeID = e.entityID
      @p1 = e.start.position
      @p2 = e.end.position
      @p0 = Geom::Point3d.linear_combination 0.5, @p1, 0.5, @p2
      @my_vector3d = @p1.vector_to (@p2)
      t = Geom::Transformation.axes @p0, @my_vector3d, @my_vector3d, @my_vector3d
      @my_comp_instance = @mymodel.active_entities.add_instance @mycomponent, t
      end
      }

      The problem is that all the arrow components are correctly created in the right direction, but it's size is null and
      almost invisible!

      What's wrong?

      posted in Developers' Forum
      T
      trottolino