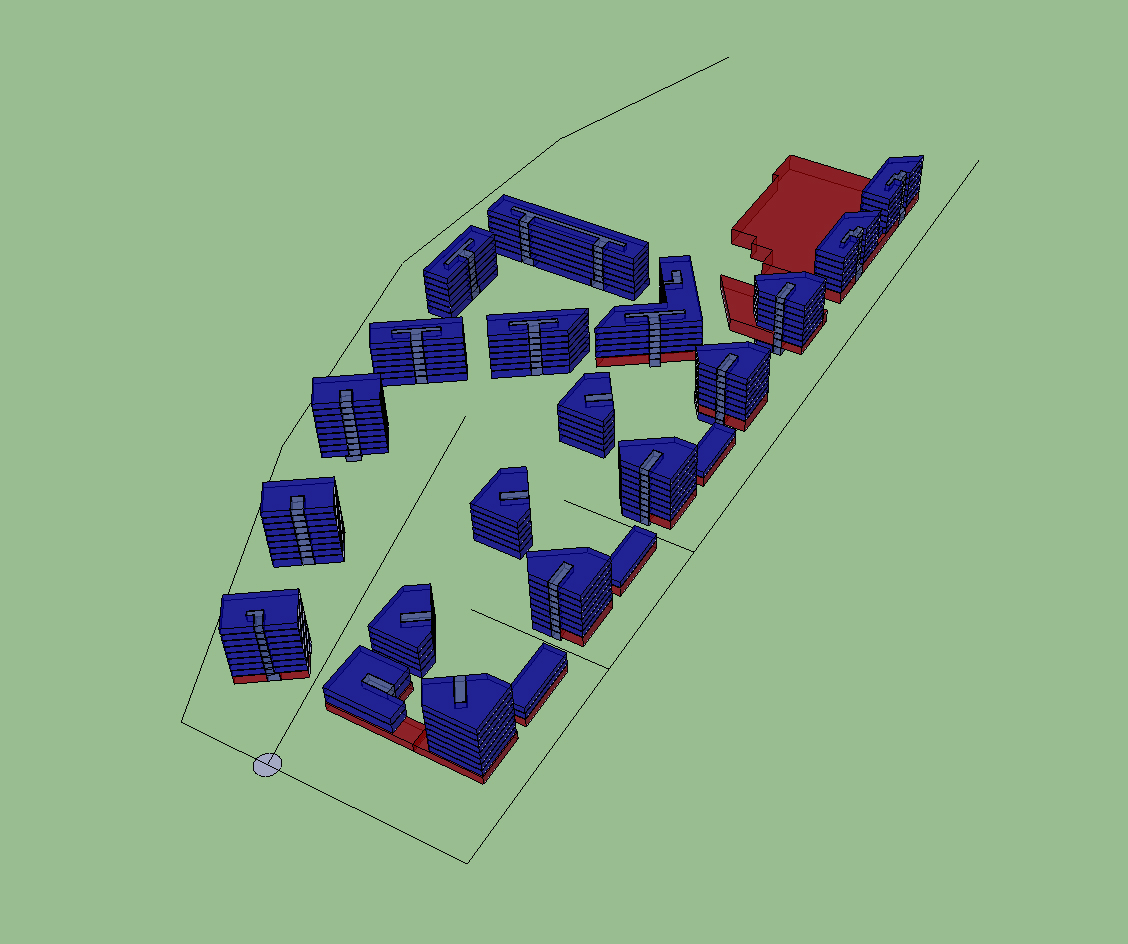
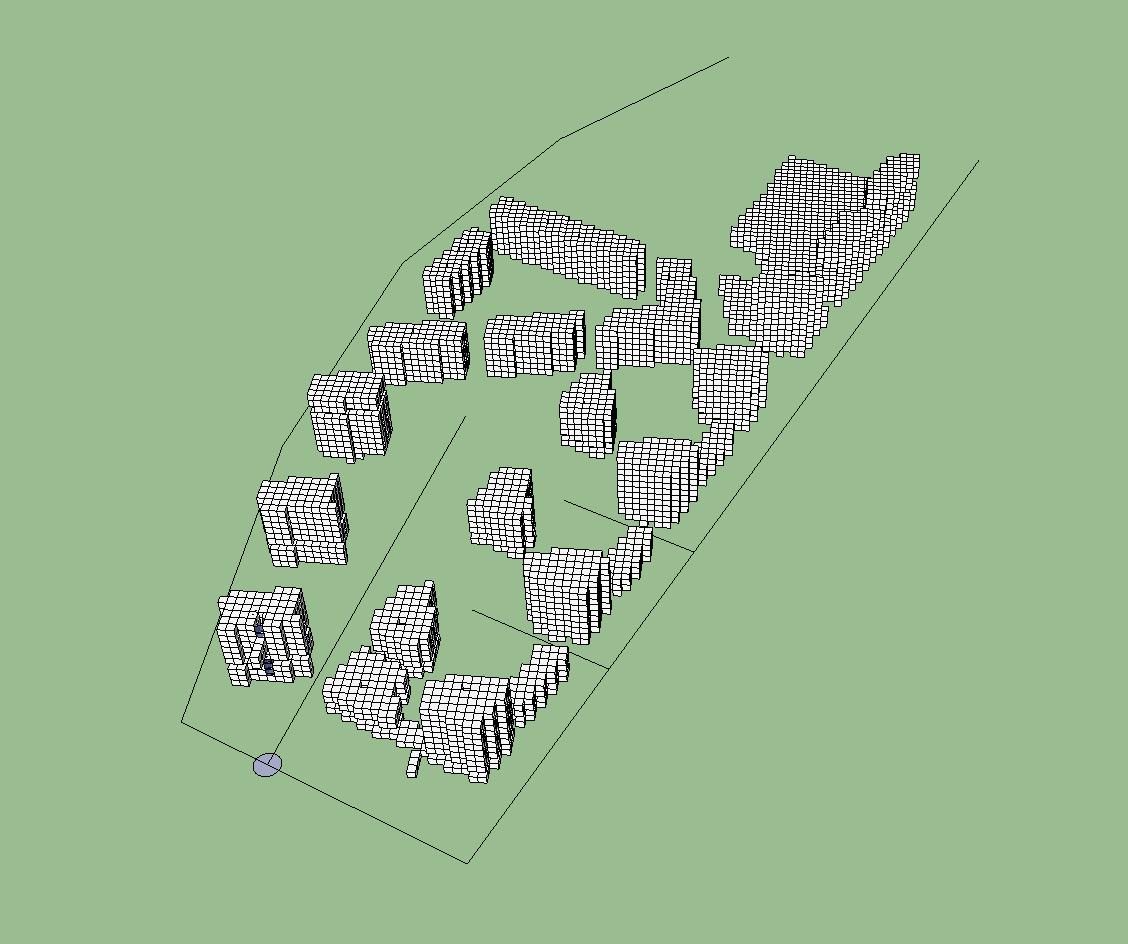
We have a point A (tram station) and a whole bunch of points B (the voxels, I guess some center point in each one of them).
We also have a network.
Then we just calculate the shortest path from A to each B1...Bn.
The result is something like this:
A->B1 : 241 meters
A->B2 : 243 meters
.
.
.
A->B5202 : 764 meters
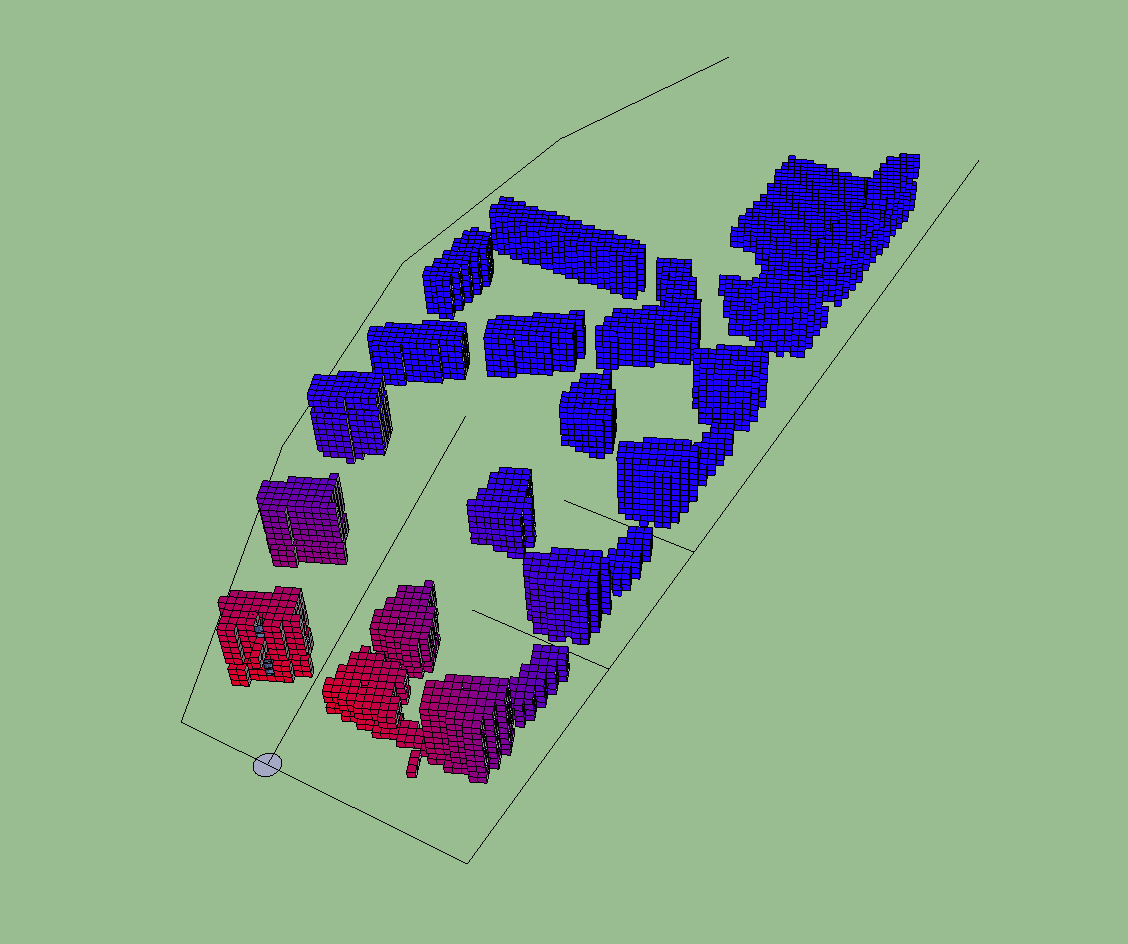
And thats the actual raw data we get. Then we can analyse it in excel or possibly integrated into the plugin, for example what is the average/median distance, or how many of these B are under 300 meters from A. Because the voxels are volume units if we calculate (the number of B under 300 meters) / (the number of all B) the result will tell us how big percentage of the planned housing volume is under 300 meters from the tram station. Etc.
I guess you could do this without voxelisation too but that would result in a lot more difficult math. And Thomthom, if I understood you correctly you suggest the voxelisation would be done for the calculation purpose but not shown on the screen? Yes that is also possible, but I thought the voxelisation would also provide a good form to visualise the results and thus give instant feedback to the designer. The voxels could be color coded based on their distance to the calculation point (the tram station in this example).