Would you be so kind to point me in the right direction regarding the following?
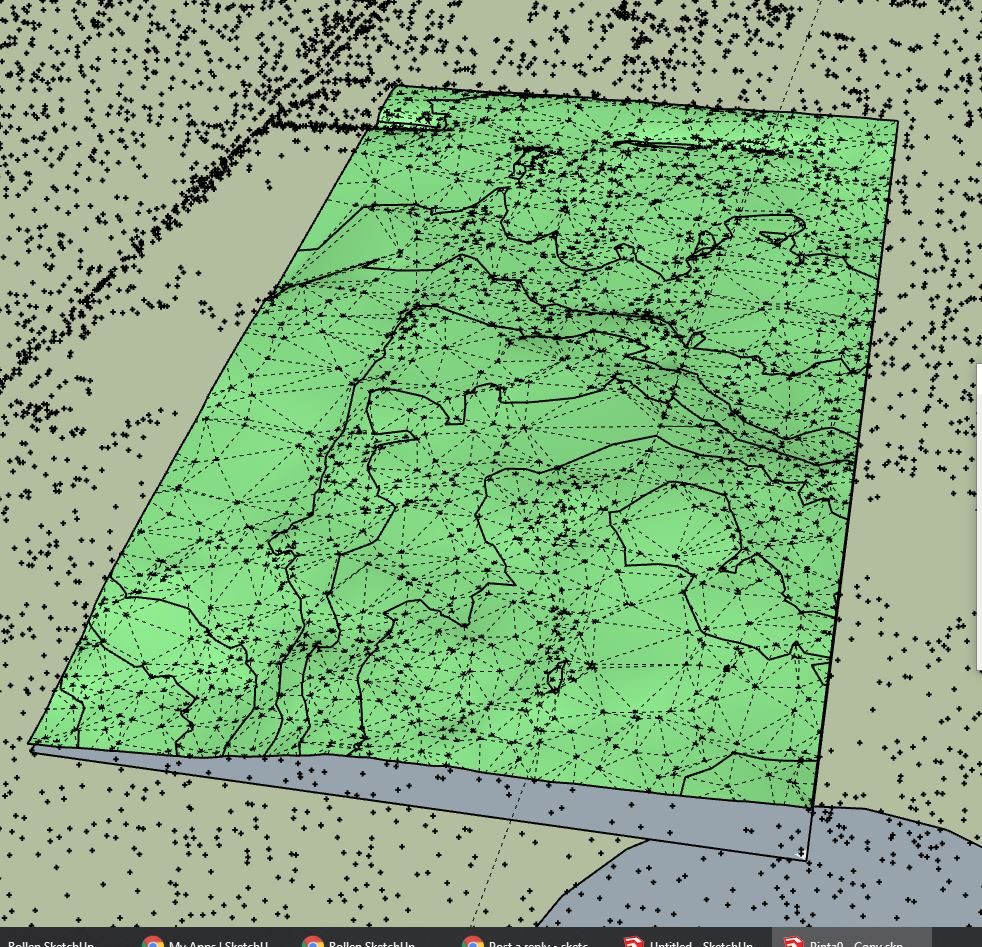
Toposhaper produces the actual terrain for which I have laser scanned data (a point cloud) from a laser scan from the air. Would you have any suggestions of how to visualise the height differences? I would somehow need to spot which sections of the terrain is e.g. in the range [33.00,33.25] meters and which in the range of [33.25,33.50] meters.
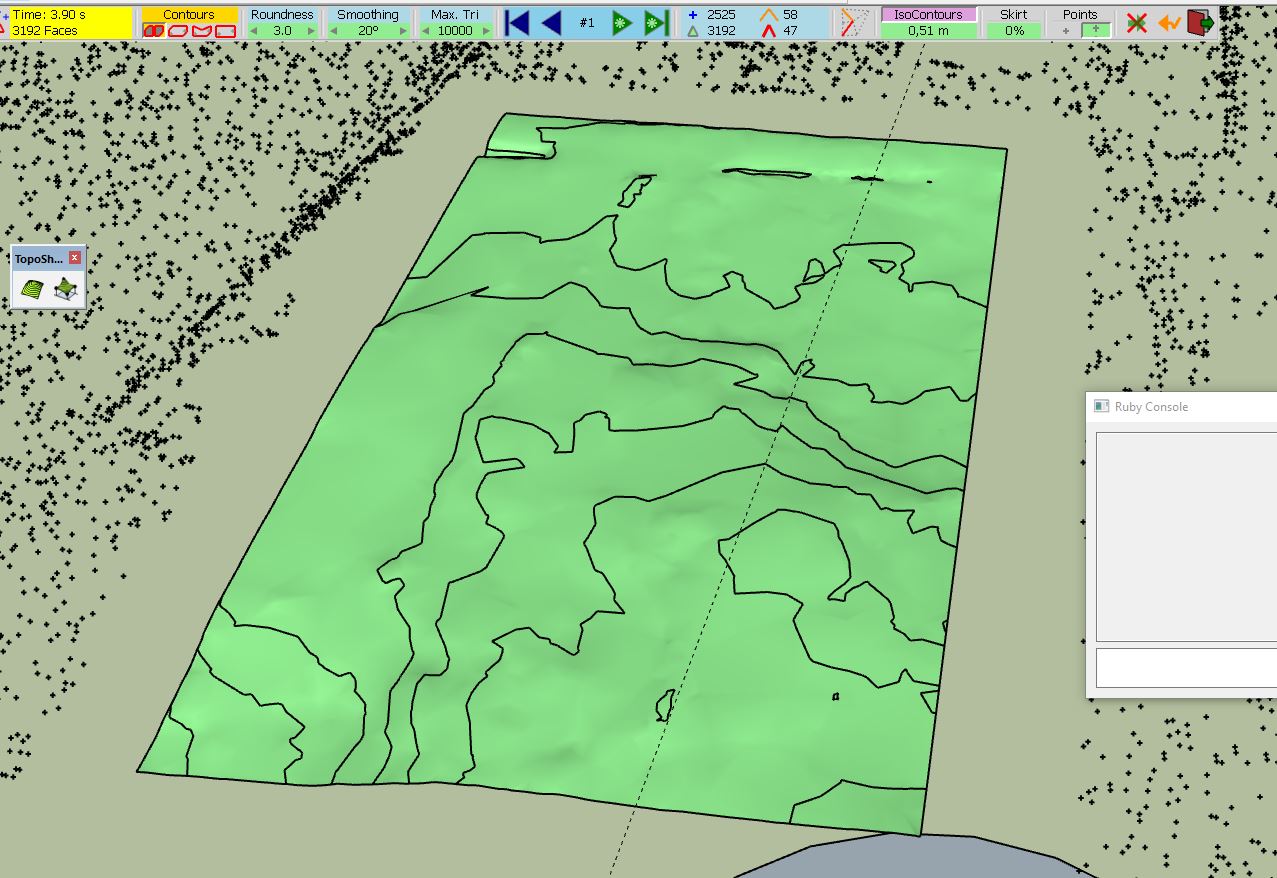
Creating isocontours with toposhaper seems rather straightforward. However, with e.g. 10 isocontours it is not possible to say which is which, e.g. that what sections the terrain are in the range [33.00,33.25]. Hence, I'm thinking of how to add colours to the faces between the isocontours.
I'm trying to figure out if this plugin could be used, https://forums.sketchup.com/t/colour-face-by-zheight-range/40883. Perhaps with some modifications. First, one must have faces to which colour can be added. Second, one must defines the colour space and add colour the the faces identified in step 1 based on their (average?) location on the z axis.