Sine Curve (wave) script?
-
http://www.smustard.com/script/GraphIt is one. K_tools has more mathmatical graphing abilities.
-
Tell me if graphit can be used to make a sine curve and, if so, how to do it?
I am mathematically "impaired".
J
-
Graphit does linear graphing, so no.
General stuff on sine curves http://en.wikipedia.org/wiki/Sinusoidal. As you can see, the trig functions sine and cosine are needed to get a rythmic, repeating pattern over a period of time.
You can start getting a sine curve with the basic formula 'y = sin x' with k_tools.
Go to: Plugins/k_tools/Graphs/2D Graph cartesian
-
Select plane xy
-
select range and resolution (keep the x range from -1 to 1, didn't seem to make much of a difference. Select a smaller number than the default .1 in Stepwidth for a smoother curve)
-
enter the y = formula - sin(40x) (40 will give something decently long, it's editable. '' is "times". 'X' is the x range in #2.)
Rescale the resulting group.
-
-
Dear John,
Like Gata said, k-tools will give you a decent sine wave. Generally, your sine wave will look like:
y = A x sin (theta),
were A is the amplitude of the sine wave and 'theta' an angle in radians. A complete sine wave curve is generated every 2 x pi radians (2 x pi = 360 deg), where pi = 3.14. To use the distance along the x axis you must turn the distance into an equivalent angle in radians.
I have generated a decent sine wave by using k-tools. Set the Graph in plane to XY. Then set the "x-Range from" to -100, and the "x-Range to" to +100, and the step to 0.1 (my Model parameters are set to mm). The step size is important as it defines how smooth the generated curve will be.
Enter the following equation into the equation window: y = A * sin((x/B)*3.14), with A = 20, and B = 10. The parameter B is the wavelength and so increasing B 'stretches' the wave (try B = 5, 10 and 20). The parameter A will increase the amplitude of the wave. The constant pi = 3.14 needs to be there to turn the ratio x/B into radians. Hope this helps.
Kind regards,
Bob
-
Thanks for the replies. I tried K-Tools but I am obviously doing something wrong.
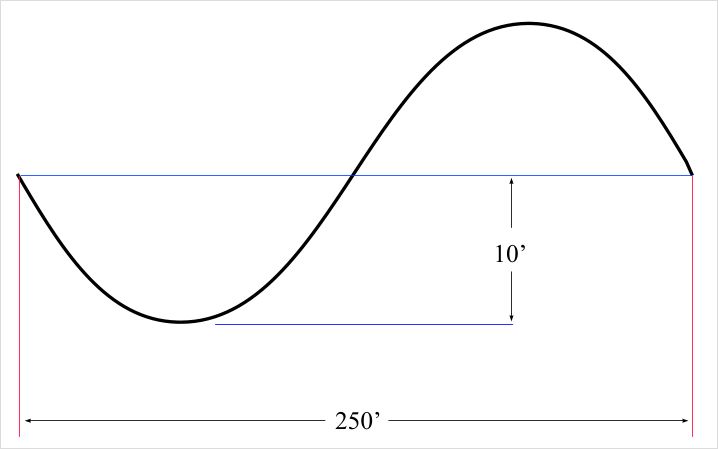
The attached is the wave specs I was given. What should the K-tools parameters be?
Regards, John
-
Here you go.
a = 10.0.feet
b = 250.0.feet
pts = []
0.step(b, 1.feet) do |x|
  y = a * Math;;sin( (x / b) * 2 * Math;;PI)
  pts << [x, y]
end
Sketchup.active_model.active_entities.add_edges pts
Edited to use feet, and use Greyhead's example, and Math::PI.
-
FYI Jim - you can use Math::PI.
Todd
-
Another way is to make a rectangle or construction lines 20' x 250' and scale the wave.
The formulas watkins and I gave are the same. When you add variables and other decorations to y = sin x, all you are doing is shifting and stretching the wave on the xy plane. SU can adjust the equation after a basic wave is created by using Move and Scale.
-
This is interesting. I began trying the tricked out formulas listed above last night. All those formulas and others are clearly detailed in my old math text. I even copied and pasted the ones above. But k_tools would not generate anything. I was stuck with using the simplified formula.
I was repeating things so often I almost wanted to tweak the script so is would remember last settings. The last time I looks, I think that means only adding a few additional lines of code.
-
Thanks, all!
Jim, about the code you posted.
Is that a snippet from a Ruby script and can it be run from the Ruby console window? Or, could a Sine Script be written that asks user for unit of measure, length and amplitude and maybe the number segments?
John
-
In K-tools you want the 2D-Graph Cartesian; Plane xy; Range & resolution 0 : 250 : 1; then Mathematical formula '10 * sin((x/250)2PI)'
Bob
PS Later: Actually this gives you 250m x 10m so needs rescaling.

-
Dear John,
I do not know if this thread is still open, but the last post suggested that you still need a little help. Something more prescriptive perhaps.
Suggested approach:
- use k_tools,
- select 2D_Graph cartesian, and
- select the plane.
Okay, you have to make a number of choices. Let us assume that you have elected to draw the sine wave on the XY plane. The first box you have to fill in is the plotting function's starting point on the X-axis. The second box is the end point for the plotting function. The step is how often you want the plotting function to calculate the equation Y=sin(theta); theta is a function of X and is dimensionless. Suppose you select X=0 as the start point, X=100 units as the end point, and X=1 units as the step, then the equation is solved at 100 points between X=0 and X=100. If you changed the step to 0.1 units then the equation would be solved at 1000 points.
The next box asks you to enter the equation for the sine wave. I imagine that at this point you are interested in:
- the amplitude of the sine wave (call this A),and
- the wavelength, or the distance between the beginning and end of a single wave (call this B).
The equation to use is Y = A * sin ((X/B) * 2 * 3.14159); you may recognise the numerical value of π. Extract from Wikipedia:
"Pi or π is one of the most important mathematical constants, approximately equal to 3.14159. It represents the ratio of any circle's circumference to its diameter in Euclidean geometry, which is the same as the ratio of a circle's area to the square of its radius. Many formulas from mathematics, science, and engineering involve π."
..and this is where it all goes pear-shaped. Because if you use 0 units, 100 units, 1 unit for the start, stop and step, and Y = 100 units * sin(( X units/100) * 2 * 3.14159) for the function, then one might expect to see a sine wave starting at X=0, finishing at X=100, with an amplitude of 100 units and a wavelength of 100 units. In other words, a single complete sine wave of amplitude 100 units between X=0 and X=100. Well, the plotting function does produce one complete wave, but with all values multiplied by 1000. Don't ask me why. It might have something to do with the way Sketchup handles small entities.
So for a single sine wave of amplitude 100 units and wavelength 100 units plotted every 1 unit, enter 0,0.1,0.001, and then use Y = 0.1 * sin((X/0.1)* 2 * 3.14159). Don't forget the multipliers '*'and the extra brackets around (X/B).
For one complete sine wave of unit amplitude and unit wavelength use k_tools and enter 0,0.001,0.00001 and then use the formula Y=0.001 * sin((x/0.001)* 2 * 3.14159). Multiply the amplitude and the wavelength to scale in amplitude and wavelength. Change the end-point for plotting (increase the distance between start and stop) for more complete waves.
Hope this helps.
Regards,
Bob -
Thank you Bob, for the clarification.
Regards, John
-
Just a couple of notes to add to the other Bob's last post.
- You can use PI in K2 Graphs formulae (saves having to type in 3.14159)
- K2 Graphs appears to use meters as a default unit. However the dimensions will show up in whatever units you have set to display. In Bob's case this seems to be millimeters, hence the need to correct by 1000. The scale factor to correct from meters to feet is .3048
Bob
-
From one Bob to another,
Oops! Should have figured that out. Must be getting slow.
Regards,
Bob -
@jclements said:
Thanks, all!
Jim, about the code you posted.
Is that a snippet from a Ruby script and can it be run from the Ruby console window? Or, could a Sine Script be written that asks user for unit of measure, length and amplitude and maybe the number segments?
John
John,
If you still want it, I can write it up.
-
Jim, yes please. I am sure to use it.

-
Pathcopy.rb has a feature that allows you to copy to spacing http://www.smustard.com/script/PathCopy. So if you rather have a nice-looking, higher-poly curve and space components by a set distance along the curve, it seems possible.
-
Hi Gata.
I do use the copy along path script and it works nicely. But the trick here is to space (subdivided) equi-distant if you will, along an existing curve. The functions that Fred06 has provided are flexible enough to aid in doing this, plus, re-manipulate/smooth some complex curves.
-
@jclements said:
Thanks, all!
Jim, about the code you posted.
Is that a snippet from a Ruby script and can it be run from the Ruby console window? Or, could a Sine Script be written that asks user for unit of measure, length and amplitude and maybe the number segments?
John
John,
Hello! It looks like you're interested in this conversation, but you don't have an account yet.
Getting fed up of having to scroll through the same posts each visit? When you register for an account, you'll always come back to exactly where you were before, and choose to be notified of new replies (either via email, or push notification). You'll also be able to save bookmarks and upvote posts to show your appreciation to other community members.
With your input, this post could be even better 💗
Register Login


Advertisement