Excel Data to Model
-
Im a fairly new Sketchup user, so bear with me if I'm not making any sense...

What I am attempting to do is design a timing cam based on an Excel spreadsheet. I have a list of data that tells how far out the edge of the cam should be from the center for all 360 degrees of rotation, and I need to design a 3D model based on that data.
On my first attempt, I drew a simple circle, converted it to a 360 sided polygon, then extruded the sections to match the Excel chart data. Tedious, yes, but fairly accurate and effective.
The problem is that when I submitted the design, they said that it didn't look right, and after they reviewed the Excel sheet they realized the data was wrong. Needless to say, I was not happy at the amount of time I had essentially wasted.
What I would like to know is if there is a way to have an Excel sheet with the measurements and import it into Sketchup and let it do all the legwork for me.
Basically, I would like it to be able to read the data and say:
Point1: 0 degrees rotation, XX inches distance
Point1: 1 degree rotation, XX inches distance
Etc - all the way up to the 360 degree mark, and then automagically connect all these points to draw the cam pattern...Hopefully this makes SOME sense to someone here...thanks in advance!
-
Use the mathematical power of Excel, to convert the polar coordinates (angle, distance) into cartesian coordinates (x,y). Add a zero z coordinate to each x,y pair.
You can then produce, from that x,y,z tabular data, a 'csv' (comma-separated-values) file. A simple copy/paste from the spreadsheet can do it, or let Excel save the file in the csv format.
Once you have a 'csv' file, containing only the x,y,z datapoints, it can be imported into SketchUp, using a ruby plugin. I use "cloud_v6.rb" from this page at The Ruby Library Depot. This plugin will create guidepoints in your SketchUp model, one for each x,y,z datapoint. See the user's guide and example data file, also available at the aforementioned url.
While the 'cloud' ruby will connect the endpoints, I'm not sure whether it will try to connect more than immediately-adjacent points. It may try to draw some lines "across" the cam perimeter, rather than just around the perimeter. (The plugin was originally developed to import terrain survey data into SketchUp.)
I use the 'cloud' plugin to import spherical/geodesic data, and skip the line drawing step. You could do the same, should it try to draw too many lines.
This is only one option. In the past, I've used Excel to produce, instead of a 'csv' file, a 'dxf' file. This takes a little more initial data formatting in Excel, but in a 'dxf' file, you can specify where to draw the lines. SketchUp can import a 'dxf' file without a plugin.
If you anticipate having to model a cam repeatedly, with adjustments in Excel for each model, I'd go with the 'dxf' method. All the major work would have to be done only once. Subsequent 'tweaking' of the data wouldn't be difficult, as Excel would do all the calculations.
Regards,
Taff -
I fear that my last post may scare you away from DXF import, which is really pretty simple, especially when using a spreadsheet to generate the required ASCII text file (you can save DXF files as ASCII text.)
To demonstrate the file internals, I have attached a simple DXF file (in a ZIP file.) In the DXF file, six LINE entities are defined, as well as a single POINT entity. A POINT, defined in a DXF file, will import as a SketchUp guidepoint. You can open the attached DXF file with a text editor, such as Notepad or Wordpad (Microsoft Windows.) Import the DXF into SketchUp, to see how it works.
DXF ASCII format for entities:
For a LINE, the data is defined with a prefix code in the line above the coordinate
10 - code for X-coordinate; starting point
20 - code for Y-coordinate; starting point
30 - code for Z-coordinate; starting point
11 - code for X-coordinate; ending point
21 - code for Y-coordinate; ending point
31 - code for Z-coordinate; ending point
(The Z-coordinate is followed by a zero, to designate the end of the line definition)The codes for a POINT entity are similar, but are limited to 10,20 & 30 (as there is no 'ending' point.)
According to the AutoDesk reference, if you have no Z-coordinate (i.e.; only 2D data,) you can exclude the Z-codes and data. (My example file contains no z-coordinates.) You DON'T have to enter:
30
0.0-or-
31
0.0
The DXF format is explained in detail at, AutoCAD 2000 DXF Reference
Scroll down to the bottom, to Appendix A, "Drawing Interchange File Formats" and then to "Writing a DXF Interface Program" and "Writing a DXF File". This leads you to the simplest explanation. If you need more details, the bulk of the reference provides ample support.
I hope this serves to clear (rather than muddy) the waters....
Taff
-
not that it really matters i suppose, since this dxf file does indeed import into sketchup, it will not import into rhino, or autocad 2000 - autocad gives this error message:
No layer specification for this object. on line 12.
Invalid or incomplete DXF input -- drawing discarded.
Regenerating model.cheers
rabbit -
Taff - thanks for bringing back the nightmare called high school geometry!

Okay, after a brief refresher course and dusting off some formulas, this is how I THINK I am supposed to solve the problem...
In my Excel file, I have two columns:
A - Angle (0 - 360)
B - Radius (variable distances from the center point of the cam)I need to convert these to X and Y values for SU
I created two new columns, called X and Y (Z doesnt matter at this point....)
In the X column, I used this formula:
=B2*(COS(A2))In the Y column, I used this formula:
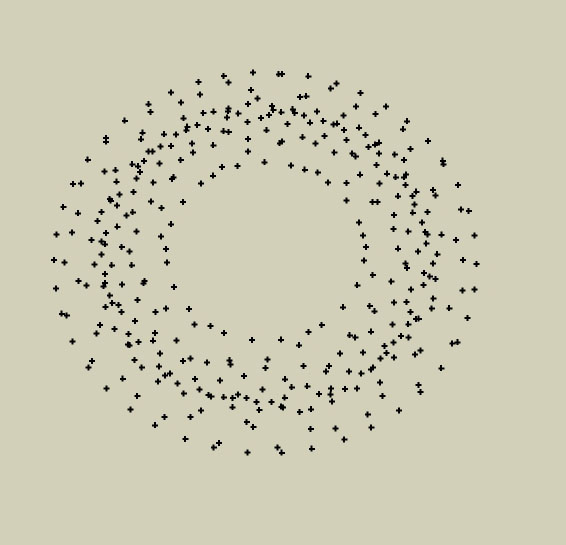
=B2*(SIN(A2))This gave me some happy little numbers in my X and Y columns, so I duplicated the formula for all rows and I got quite a bit of data. When I try importing it using the Cloud plugin (which I had been playing with for a couple days prior to my initial post) it brings in all 360 points, but it looks nothing like what I expect to see...
I expect to see a series of dots with a smooth, flowing outline - what I get is a bunch of scattered points...
Any help or suggestions are greatly appreciated....I am attaching a screenshot of the results in SU.

-
@rabbit said:
...it will not import into rhino, or autocad 2000
Not surprised -- I kept the included elements to the bare minimum -- only those required for SketchUp.
Taff
-
aspaddict,
If you can share the csv data, I can write an importer fairy fast. Post it here, or PM it to me.
-
aspaddict,
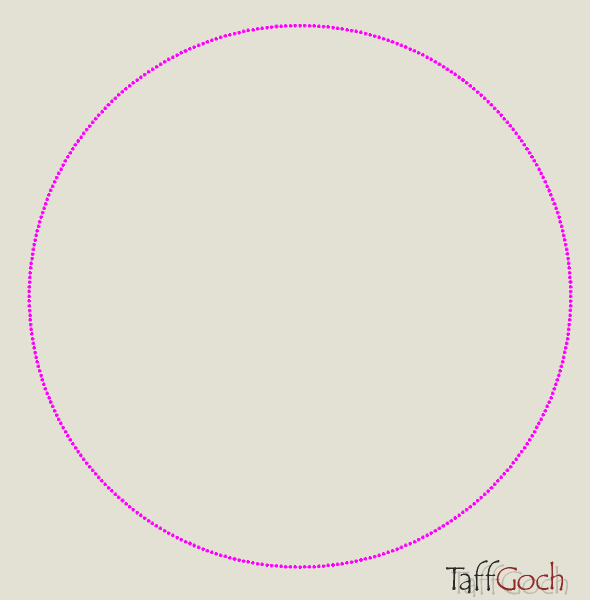
I generated Excel data, using the above equations, for 360 degrees (converted to radians, of course) and unit radius (1.0)
I imported the data into SketchUp, using 'cloud_v6', as did you. The attached image is the result.
Taff

-
@aspaddict said:
....thanks for bringing back the nightmare called high school geometry!
You weren't one of those students who thought, "I'm never going to need this!" were you?
[EDIT - Ignore this; see subsequent postings
I think the problem is likely due to +/- values of either the angle input, or sin/cos output. Try this - do only one quadrant, where the results will be all positive. Stick to the range of 0-90 degrees, and see what you get.
[END EDIT]](You can attach your spreadsheet, dxf and skp, if you want, but you're might have to zip them first.)
Taff
-
aspaddict,
I've been playing with Excel a little, and I think your problem is that the SIN and COS functions expect the angle parameter to be in units of RADIANS. If you haven't already, try these:
=B2*COS(RADIANS(A2))
=B2*SIN(RADIANS(A2))
I'll keep testing in Excel, to see if there might be some other "gotchas" to confound your calculations.Taff
-
Taff, this is epic! You really need a blog page to show off the cool stuff you do with SketchUp, that is totally different to what everyone else does!
Hwyl

[Edit: Actually this reminds me of something I have been thinking about for some time. You are obviously very mathematically-inclined, how difficult would it be to do a similar thing for a rippled surface in SketchUp. Lots of people have trouble with this, and I'm guessing that it's a mathematical function relating to amplitude. Accurender has a nifty function which can add one of 2 types of ripple to surfaces. Water is the main use for this. For rendering it makes a big difference. Is it possible, given a predetermined surface, to plot the mathematical function relating to ripples, and create the geometry to describe these sorts of surfaces? For rendering purposes, it would be really useful.]
-
@bigstick said:
...need a blog page to show off the cool stuff you do with SketchUp, that is totally different to what everyone else does!
Jim,
Hah! History repeats itself. What I'm doing here is actually an 'old school' technique from the introductory IBM-PC days (early 1980s.)
DXF was a ubiquitous file format back then, as it is now. Getting spreadsheet data (anyone remember VisiCalc?) into a CAD program was handled in the manner I used. Conceptually, it's simple, relatively easy to understand, nothing but text, and can be used with many programs (...and I'm getting to be an old dog, comfortable with my old tricks.)
Regarding ripples and waves, even PhotoShop can apply such 'distortions' to an image. The mathematical simulation of waves has been "algorithmized" in many ways, and 3D graphics articles/papers have been published by students/professors in the major graphics journals. These guys know much, MUCH more than do I on the subject. Modification and application into a SketchUp ruby is the missing exercise, but with a bit of homework, shouldn't be too difficult for an experienced ruby 'scripter' (of which, I am not.)
-
aspaddict,
I've a fair amount of experience in scientific/mathematical use of Excel, so producing a DXF file from a spreadsheet isn't too difficult for me. I realize that may not be true for you, so I've attached a ZIP file containing a spreadsheet that demonstrates how it's done.
(Please don't ask about the rather convoluted Excel formulae, 'cause it would require instruction in Excel. I suspect the formulae could be simplified further, as the newest version of Excel is giving me fits!)
The spreadsheet is protected to prevent structural changes, as that would 'break' its functionality. The only cells that can be modified are those that specify the length of the radial distances. The angles, and formulae for the x,y data are locked. They can not be modified unless you unprotect the spreadsheet. The formulae in the column of text for the DXF file are also locked from modification. You can copy and paste the DXF text, after your changes to the length parameters automatically modify the DXF info for you.
The spreadsheet should allow you to do plenty of "what if" adjustments to the length values.
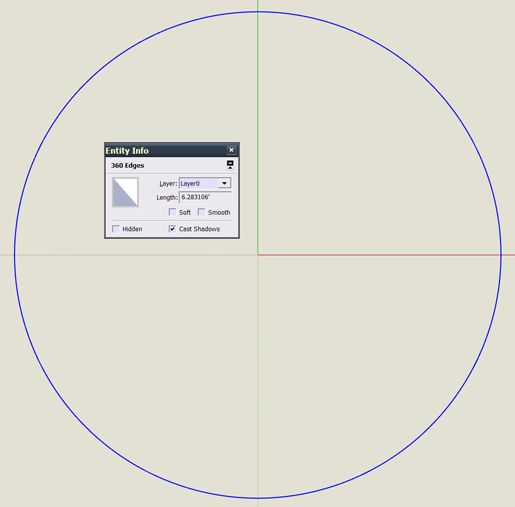
I've also included the resulting DXF file, and a screengrab image of the SketchUp import (depicting 360 line entities.)
Regards,
Taff

-
Taff,
hay thanks for this thread it is just what I was looking for. I an trying your method and an having a problem and I am hoping you can help.when I try to import excel data I get this error in the ruby window.
Error: #<TypeError: nil can't be coerced into Length>
(eval):147:in*' (eval):147:inimport_points_cloud'
(eval):144:ineach' (eval):144:inimport_points_cloud'
(eval):481
(eval):147:in `call'
(eval):147I have tried opening the file in text edit but can see no problem.
here is the CVS file I am trying to use.any suggestions to what I am doing wrong and how I can fix it would be greatly appreciated.
Thank you and keep up the good work
Uberchurch
-
That worked BEAUTIFULLY! The RADIANS function is what I was missing out on...
...and yes, I was one of THOSE kids who said "Meh, I'll never need this later in life..." (Time to call my kids and warn THEM!)
Is there any quick and dirty way to connect all the points, or do I just need to use the line tool to achieve this? I need to connect them, then group them all together...
I think I can handle drawing 360 little lines at this point - the hard part is done - but if there's a smoother way of doing this, I'd prefer to go that route...
Thanks for the help!
-
@aspaddict said:
Is there any quick and dirty way to connect all the points...
Um,
The "Excel&DXF" example files I provided do precisely that. Extract the zip files and see if they do the trick. -
uberchurch,
I downloaded your file, opened it with Wordpad, copied everything to the clipboard, opened Notepad, pasted, and saved the file with a '.csv' extension.
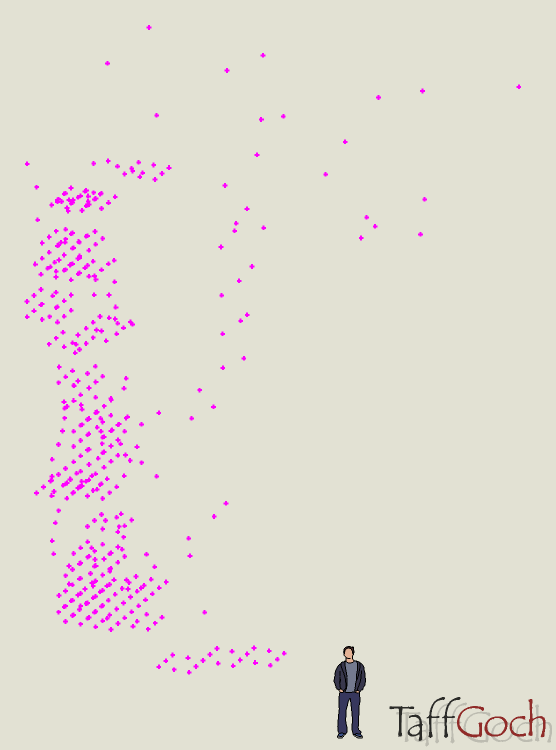
The contents look okay. It may be that the extra carriage-return/line-feed info that Wordpad inserts is causing a problem. (I don't know for certain.) I can tell you that, with your data in an ASCII-text '.csv' file, the "import cloud" plugin worked fine. (See attached.)

-
Taff,
thanks for your help. I think the problem has to have something to do with the fact that I am on a mac because when I open the file that your created (thank you) which we know works I get the same error. But when I open it on a PC it is OK, although only with control points not components which is what I really need. So for now I will just create the point clouds on the PC and then bring it back to the MAC. Thanks again for your help and if you have any idea how I can replace the points with geometry that would be great.
Thanks Again
Uberchurch -
hello everyone,
i need the same tool as describe, but to make another shape:
i must draw line (i have the length),circle arc (i have the rayon and the angle of courbure), and slope (i have the length up or down).
all my data are in an excel
Can i use it automatically to make my way?
thx u 4 adavnce
Advertisement


