[Talk] Ruby Debugger for SketchUp 14+
-
Topic thread for the new Ruby Debugger for SketchUp 14+.
-
It would be nice if the library file (DLL, etc.) could be installed and maintained as a
SketchupExtensionfrom it's own subdir of the "Plugins" directory.Is it possible ? Perhaps the extension could have a modify date file checker (using
File.mtime,) that copies the dll from the extension subdir, to a required location (if it cannot be loaded by the executable from a subdir of the binary directory.) -
The debugger has a console interface. From the command line:
$ Sketchup.exe -rdebug consoletype 'h' for help.
-
@jim said:
The debugger has a console interface.
Tried that. (Actually made a new desktop shortcut that has the above command.)
Need to type 'c' in the console to allow SketchUp to finish loading.
Tried to list global vars but nothing happens.
-
Also tried Aptana Studio 3. It connects with SketchUp ok if the port is the deafult 1234.
But I thot it might be better if each version used it's own port numbered after itself... ie, port 2014.
But I could not get the two (Su & IDE to connect on port 2014.Also when I "run" a file, it runs using the System Ruby 2.0, instead of loading into SketchUp's Ruby.
-
After you cont, set a breakpoint:
b foo.rb:line_nouses regex on file_name, so even a partial filename should work.
Then go to SketchUp and run the method with the breakpoint.
foo()Then you should see the result in the console. You can list, and step, and view variables.
-
Played with this today - sort of an IDE simulator. This is not a plugin - meant to be run from installed Ruby.
I can get a response when setting and deleting breakpoints, but the breakpoints don't seem to work when I run in SketchUp.
require 'socket' def main s = TCPSocket.open('localhost', 1234) print "Connected.\n> " while line = gets break if line[/^q/] send(s, line) rec(s) print "> " end rescue s.close end def send(s, msg) s.write(msg) end def rec(s) ready = IO.select([s], nil, nil, 0.2) if ready puts ready[0][0].recvfrom(4096) else puts "timeout." end end main() -
I've never used an IDE. What's the point of all of this?
What does it provide over notepad++? -
@jiminy-billy-bob said:
I've never used an IDE. What's the point of all of this?
What does it provide over notepad++?The debugger let's you set a breakpoints at lines in a ruby file. When execution reaches a breakpoint, you are dropped into the debugger where you can inspect variables and step through the program a line at a time. Some IDE's can interface with the debugger and let you set breakpoints, step, and follow variables from within the IDE.
The code I posted might be used as a starting point to interface a simple editor with the debugger.
-
Ok so it's a faster way to get the same thing than reading the error's number line in the ruby console and check it in notepad++?
-
@jim said:
The code I posted might be used as a starting point to interface a simple editor with the debugger.
I have d/l'd a couple of gems to do this:
ruby-debug-ide-0.4.22.gem (written by the RubyMine folks)
debase-0.0.9.gem (a dependancy of the above.)Haven't gotten them installed yet.
-
@jiminy-billy-bob said:
Ok so it's a faster way to get the same thing than reading the error's number line in the ruby console and check it in notepad++?
The "I" in IDE means integrated.
An IDE has panes, some of which are variable lists, editor, console, object tree, project tree, etc.
I think some IDEs have used the Scintilla editor engine which NotePad++ also uses.
In an IDE you usually set breakpoints by clicking in the margin if the editor pane, and a breakpoint icon appears. (In Notepad++, it is a blue sphere.)
-
@dan rathbun said:
@jim said:
The code I posted might be used as a starting point to interface a simple editor with the debugger.
I have d/l'd a couple of gems to do this:
ruby-debug-ide-0.4.22.gem (written by the RubyMine folks)
debase-0.0.9.gem (a dependancy of the above.)Haven't gotten them installed yet.
The above gems require building with the DevKit, for the system Ruby install.
I'm installing the DevKit today for my main system Ruby, but not for SketchUp's Ruby. (I really do not know if I should attempt hooking the DevKit into SketchUp's Ruby install as the folder structure does not follow the norm.)
@unknownuser said:
The ruby-debug-ide protocol has been mostly implemented so any Ruby IDE that supports this protocol should work. We have tested with Aptana RadRails, NetBeans (with Ruby community plugin) and RubyMine.
So... it seems we do not need to install the above gems into SketchUp's Ruby ? (confirmation requested.)
-
@jiminy-billy-bob said:
Ok so it's a faster way to get the same thing than reading the error's number line in the ruby console and check it in notepad++?
Not exactly.
The debugger will let you:
- Stop execution of a Sketchup/Ruby script at some given line. (breakpoint.) Multiple breakpoints can be set across files.
- Inspect local and global variable at that line.
- Inspect the call stack at that breakpoint.
- Step through the following script lines one at a time. Goto 2
If Notepad++ can do that, then I've been missing out. And if it were only a faster way to do the same thing, wouldn't that be worth investigating?
Here's the help listing for the console debugger:
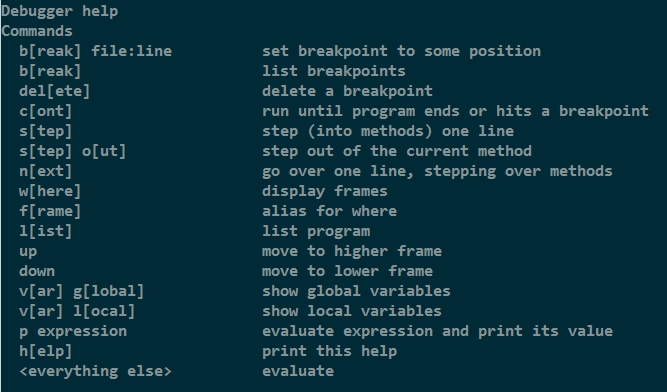
-
I'm not interested in installing a 100+ MB IDE in order to write plugins and to use the debugger efficiently, which is the reason I am playing with getting my editor (vim) to talk to the debugger.
Since the su debugger communicates over a tcp socket, there is a chance of creating an intermediate service between the editor and the debugger. Unfortunately, Notepad++ might require a c/c++ plugin to interface with the SU Debugger.
-
@jim said:
If Notepad++ can do that, then I've been missing out.
I may be confused with the "bookmark" feature. (But normally a bookmark feature allows giving them names. NPP does not allow giving them names, making them "act" like breakpoints.)
-
@jim said:
I'm not interested in installing a 100+ MB IDE in order to write plugins and to use the debugger efficiently, ...
Hmmm... I came across Arcadia. It's written in Ruby, and is less than 1MB (~600KB).
It uses Tcl/Tk for GUI elements, so make sure that is installed in your system Ruby.
http://arcadia.rubyforge.org/ -
@jim said:
The debugger will let you:
- Stop execution of a Sketchup/Ruby script at some given line. (breakpoint.) Multiple breakpoints can be set across files.
- Inspect local and global variable at that line.
- Inspect the call stack at that breakpoint.
- Step through the following script lines one at a time. Goto 2
Oh now that sounds might interresting!
@jim said:
And if it were only a faster way to do the same thing, wouldn't that be worth investigating?
Sure! I was just trying to understand the whole thing. I never heard of breakpoints before. (My coding knowledge is limited to html/css, js, and a little ruby)
-
It appears you (the ide) must maintain the tcp connection to the debugger for the duration of the debugging session. The debugger does not respond if you try to reconnect and send messages after closing the connection.
It seems like you should be able to close and connect to the debugger as long as it is running.
This means any type of Editor -> SketchUp Debugger bridge can only connect once and needs to stay running the duration of the user's debugging activities. I was hoping to use a small script executed from the editor that would connect -> send message -> disconnect to the debugger.
-
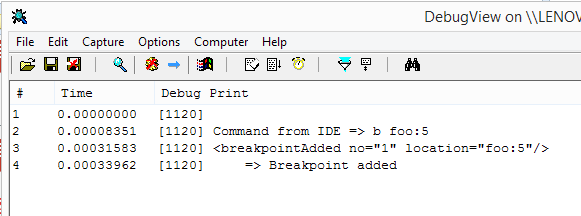
The SketchUp debugger is logging messages, so having a windows debugger such as DbgView open can be useful.
Hello! It looks like you're interested in this conversation, but you don't have an account yet.
Getting fed up of having to scroll through the same posts each visit? When you register for an account, you'll always come back to exactly where you were before, and choose to be notified of new replies (either via email, or push notification). You'll also be able to save bookmarks and upvote posts to show your appreciation to other community members.
With your input, this post could be even better 💗
Register Login


Advertisement