[Talk] Ruby Debugger for SketchUp 14+
-
Ok so it's a faster way to get the same thing than reading the error's number line in the ruby console and check it in notepad++?
-
@jim said:
The code I posted might be used as a starting point to interface a simple editor with the debugger.
I have d/l'd a couple of gems to do this:
ruby-debug-ide-0.4.22.gem (written by the RubyMine folks)
debase-0.0.9.gem (a dependancy of the above.)Haven't gotten them installed yet.
-
@jiminy-billy-bob said:
Ok so it's a faster way to get the same thing than reading the error's number line in the ruby console and check it in notepad++?
The "I" in IDE means integrated.
An IDE has panes, some of which are variable lists, editor, console, object tree, project tree, etc.
I think some IDEs have used the Scintilla editor engine which NotePad++ also uses.
In an IDE you usually set breakpoints by clicking in the margin if the editor pane, and a breakpoint icon appears. (In Notepad++, it is a blue sphere.)
-
@dan rathbun said:
@jim said:
The code I posted might be used as a starting point to interface a simple editor with the debugger.
I have d/l'd a couple of gems to do this:
ruby-debug-ide-0.4.22.gem (written by the RubyMine folks)
debase-0.0.9.gem (a dependancy of the above.)Haven't gotten them installed yet.
The above gems require building with the DevKit, for the system Ruby install.
I'm installing the DevKit today for my main system Ruby, but not for SketchUp's Ruby. (I really do not know if I should attempt hooking the DevKit into SketchUp's Ruby install as the folder structure does not follow the norm.)
@unknownuser said:
The ruby-debug-ide protocol has been mostly implemented so any Ruby IDE that supports this protocol should work. We have tested with Aptana RadRails, NetBeans (with Ruby community plugin) and RubyMine.
So... it seems we do not need to install the above gems into SketchUp's Ruby ? (confirmation requested.)
-
@jiminy-billy-bob said:
Ok so it's a faster way to get the same thing than reading the error's number line in the ruby console and check it in notepad++?
Not exactly.
The debugger will let you:
- Stop execution of a Sketchup/Ruby script at some given line. (breakpoint.) Multiple breakpoints can be set across files.
- Inspect local and global variable at that line.
- Inspect the call stack at that breakpoint.
- Step through the following script lines one at a time. Goto 2
If Notepad++ can do that, then I've been missing out. And if it were only a faster way to do the same thing, wouldn't that be worth investigating?
Here's the help listing for the console debugger:
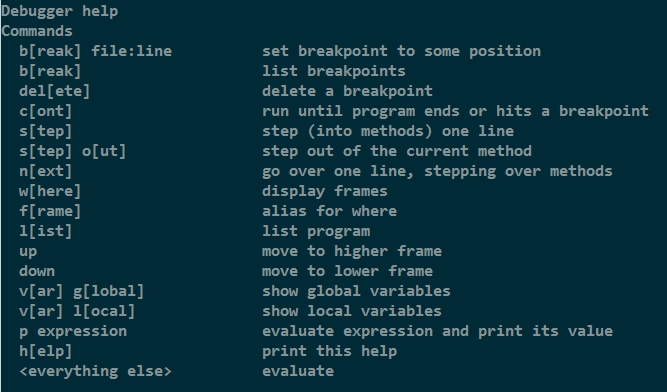
-
I'm not interested in installing a 100+ MB IDE in order to write plugins and to use the debugger efficiently, which is the reason I am playing with getting my editor (vim) to talk to the debugger.
Since the su debugger communicates over a tcp socket, there is a chance of creating an intermediate service between the editor and the debugger. Unfortunately, Notepad++ might require a c/c++ plugin to interface with the SU Debugger.
-
@jim said:
If Notepad++ can do that, then I've been missing out.
I may be confused with the "bookmark" feature. (But normally a bookmark feature allows giving them names. NPP does not allow giving them names, making them "act" like breakpoints.)
-
@jim said:
I'm not interested in installing a 100+ MB IDE in order to write plugins and to use the debugger efficiently, ...
Hmmm... I came across Arcadia. It's written in Ruby, and is less than 1MB (~600KB).
It uses Tcl/Tk for GUI elements, so make sure that is installed in your system Ruby.
http://arcadia.rubyforge.org/ -
@jim said:
The debugger will let you:
- Stop execution of a Sketchup/Ruby script at some given line. (breakpoint.) Multiple breakpoints can be set across files.
- Inspect local and global variable at that line.
- Inspect the call stack at that breakpoint.
- Step through the following script lines one at a time. Goto 2
Oh now that sounds might interresting!
@jim said:
And if it were only a faster way to do the same thing, wouldn't that be worth investigating?
Sure! I was just trying to understand the whole thing. I never heard of breakpoints before. (My coding knowledge is limited to html/css, js, and a little ruby)
-
It appears you (the ide) must maintain the tcp connection to the debugger for the duration of the debugging session. The debugger does not respond if you try to reconnect and send messages after closing the connection.
It seems like you should be able to close and connect to the debugger as long as it is running.
This means any type of Editor -> SketchUp Debugger bridge can only connect once and needs to stay running the duration of the user's debugging activities. I was hoping to use a small script executed from the editor that would connect -> send message -> disconnect to the debugger.
-
The SketchUp debugger is logging messages, so having a windows debugger such as DbgView open can be useful.
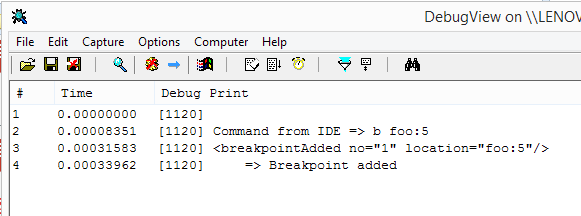
-
The Readme on Github says that Mac is not supported yet, but the repository contains project files for Xcode and build succeeded on my Mac. However, there is no discussion of where to put the dylib or how to invoke it. I tried putting it with the other dylibs in the Frameworks folder and activating with the command line args as suggested for Windows, but I can't see any evidence that it does anything (SU starts and seems to run as normal...). Has anybody gotten this to work on Mac yet?
Steve
-
@slbaumgartner said:
Has anybody gotten this to work on Mac yet?
been awaiting your return, I only had a brief look...
than ran...
john -
@slbaumgartner said:
The Readme on Github says that Mac is not supported yet, but the repository contains project files for Xcode and build succeeded on my Mac. However, there is no discussion of where to put the dylib or how to invoke it.
Work in progress. I don't recall right now if you will need a new release of SU for OSX before it will work. I'll check in.
-
Do these IDE's somehow notify SketchUp that the file has been modified and needs to be reloaded by SketchUp?
-
Bugra said they implemented the communication protocol that some of the Ruby debugger gems also implement. Documented (somewhat) here:
-
Here is a demo video of a Notepad++ plugin I am working on for SketchUp Debugger communications.
It is written in Python and requires the PythonScript plugin for Notepad++. The video shows setting a breakpoint, inspecting local variables, and stepping through the script.
There's no user interface and I use a lot of typed commands, so it is best to watch the video in high quality and full screen.
Just made it to show possibilities/measure interest/gather feedback.
-
Nice! Can't wait to try this
-
@jim said:
Here is a demo video of a Notepad++ plugin I am working on for SketchUp Debugger communications.
I'd much rather stay with using NP++.
Why Python, and perhaps GitHub it ?
-
@dan rathbun said:
Bugra said they implemented the communication protocol that some of the Ruby debugger gems also implement. Documented (somewhat) here:
I am wondering if this ruby debug ide protocol is based on (or compatible with,)
the DBGp protocol: http://www.xdebug.org/docs-dbgp.php#description
Hello! It looks like you're interested in this conversation, but you don't have an account yet.
Getting fed up of having to scroll through the same posts each visit? When you register for an account, you'll always come back to exactly where you were before, and choose to be notified of new replies (either via email, or push notification). You'll also be able to save bookmarks and upvote posts to show your appreciation to other community members.
With your input, this post could be even better 💗
Register Login


Advertisement